GET YOUR MOTOR RUNNING - ARE YOU READY FOR THE NEXT UP-CYCLE?
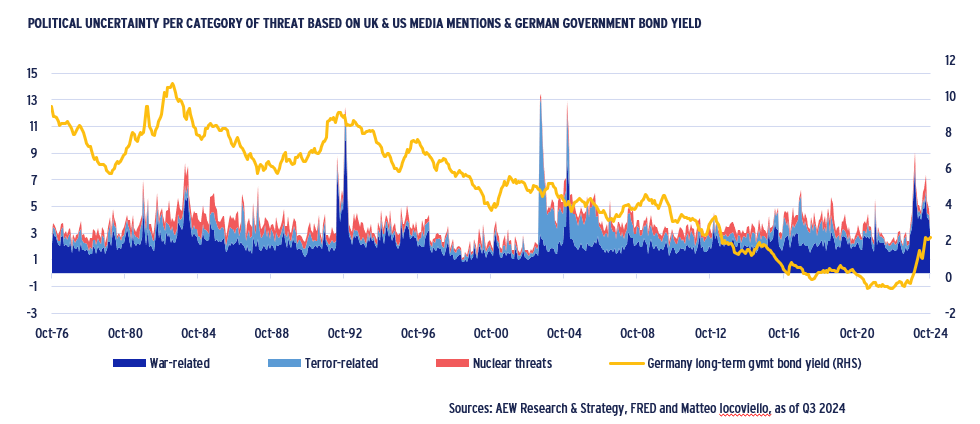
In late November, we can make up the balance for 2024. Geopolitical uncertainty remains top of mind with many investors. Armed conflicts in Ukraine and the Middle East have further escalated and are not showing any signs of resolution, as shown in the chart. Despite these uncertainties, central banks have started to cut interest rates since inflation has been brought back to their target level. Inflation might become a concern again if newly elected governments take policy actions on promised immigration restriction and trade barriers. In the meantime, Germany remains in a shallow recession even if a broader Europe-wide recession has been avoided. Bond and stock markets have rebounded as some of the expected rate cuts have already materialised. The key question for our 2025 European Outlook is “As investors consider various macro scenarios and deal with legacy pain from the recent down-cycle - is it time to get ready for the next up-cycle?”
GREEN LIGHT FOR EUROPEAN PROPERTY, ESPECIALLY PRIME OFFICES
- Central banks began their widely expected rate cuts early H2 2024 as inflation was pushed below their targets. Despite Germany remaining in recession, our modest 20-country GDP growth forecast is unchanged. Our average government bond yield is forecast to decline to 3.0% by 2029 from 3.2% at Q3 2024.
- Eurozone borrowing costs are expected to reduce marginally to 3.6% by Q4 2025 from 3.8% in Q3 2024. At 5.2%, prime cross-sector Eurozone property yields are already making debt accretive to equity investors. This is also true for the UK but to a lesser extent, as UK swap rates and margins remain higher than in the Eurozone.
- Our latest base case forecast shows prime rental growth unchanged from our March 2024 forecasts at 2.1% p.a. for 2025-29. Prime office rental growth tops all sectors at 2.6% p.a. edging above residential and logistics. Increasing secondary office vacancy rates demonstrate continued bifurcation with prime.
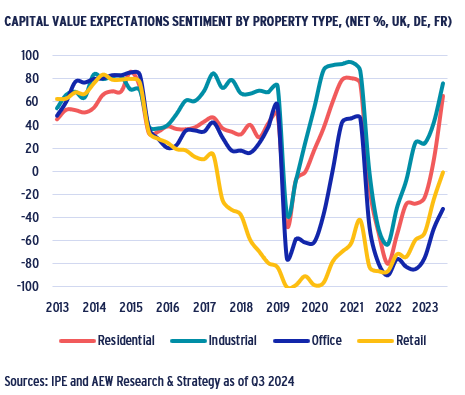
- Reflecting more supportive fundamentals, the Q2 2024 IPE Real Assets Expectations Indicator survey showed the strongest improvement in sentiment since 2013, with both residential and industrial performing best overall. While offices and retail sentiment have been trailing behind, both have improved significantly.
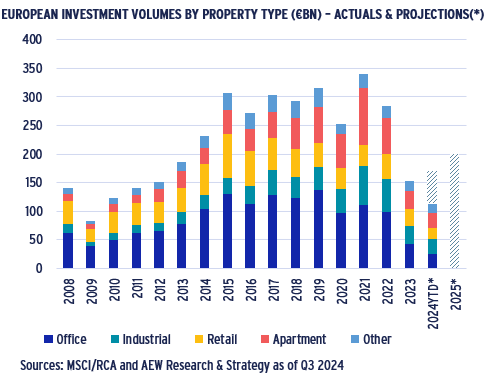
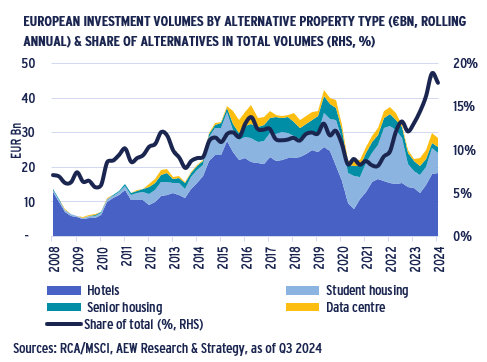
- The projected 2024 and 2025 European transaction volumes of €170bn and €200bn are ahead of 2023’s €150bn, as bid-ask spreads narrow, with low volumes driven by value declines in offices and other core sectors. Alternatives sectors have expanded their share and stand at a record 18% of 2024 YTD volumes.
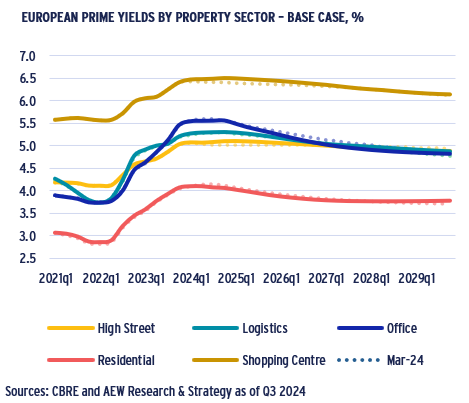
- With bond yields projected to come in, prime office yields are forecast to tighten most at 70 bps over the next five years, followed by logistics and shopping centres both at 40 bps with prime residential and high street retail coming in by 30 bps and 20 bps respectively.
- Our base case projected rents and yields result in a 9.2% p.a. (2025-29) return across all sectors. However, if recent concerns for higher inflation and slower and fewer policy rate cuts materialise in the long term, our downside scenario quantifies the impact of these risks and still shows a total return of 8.6% p.a.
- Offices offer the highest returns of all prime sectors at 10.9% p.a. over the next five years on the back of repricing, improved projected rental growth and yield tightening, with France projected to outperform with an average total return of 10.3% p.a.
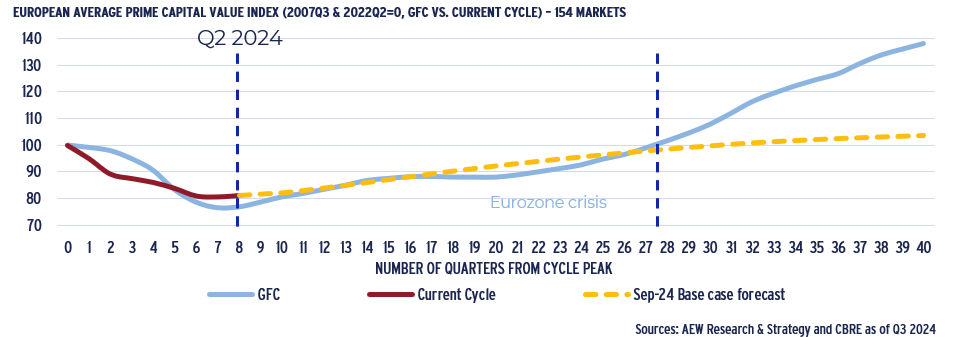
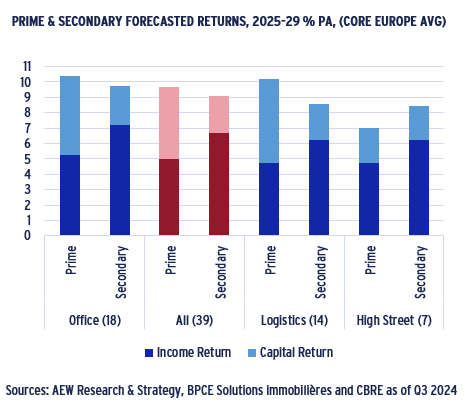
For the first time, AEW also forecasts secondary rent and yield comparisons across our 39 covered sectors, with returns projected at 9.7% p.a. and 9.1% p.a. for prime and secondary respectively. However, secondary returns offer more income certainty with a yield of 6.7% while prime returns rely more on capital growth. - These seemingly optimistic forecasted returns are in line with the actual recovery of capital values post global financial crisis (GFC). After a similar, two years downturn it took 7-years to return to pre-GFC levels. Our current base case projects capital values to return to their Q2 2022 level only after 7.5 years, by Q4 2029.
- Further positive momentum on the refinancing challenge with our estimated €86bn debt funding gap (DFG) for 2025-27 down from the €99bn forecast for 2024-26. As a share of loan originations, the DFG is now 13% for the next three years, down from 17%, with German and office-backed loans making up the largest share.
- Our relative value analysis presents another green light for investors, with 92% of covered European markets classified as attractive or neutral. This is based on a 9.0% p.a. average expected rate of return and an increased 7.3% p.a. required rate of return, offering a 170 bps positive excess spread across all 168 markets.
ECONOMIC BACKDROP – CENTRAL BANK RATE CUTS TO PROVIDE SUPPORT
MODEST MULTI-SPEED GDP RECOVERY PROJECTED
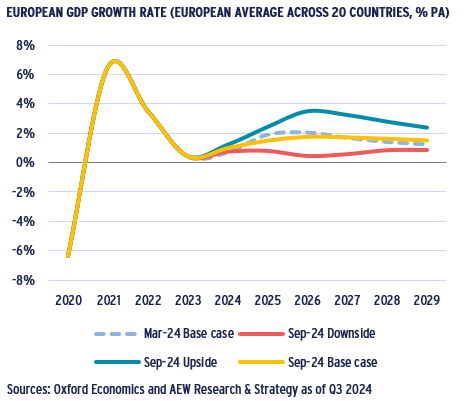
- In its latest update, Oxford Economics forecasts for our 20-country average GDP to grow by 0.8% in 2024 and 1.1% in 2025.
- This reflects a modest downgrade mostly based on disappointing German growth. Europe’s largest economy remained in recession after posting negative GDP growth in H1 2024.
- A modest, multi-speed economic recovery for 2025 is projected as German GDP growth is forecast at 0.5% for 2025, followed by France at 1.0% and the UK at 1.5%.
- This growth differential can be explained by different vulnerabilities to the armed conflicts in Ukraine and the Middle East as well as monetary policies targeting inflation until recently.
- As before, our downside scenario reflects lower GDP growth that could be a result of an unexpected increase in inflation forcing central banks to reverse recent rate cuts.
- In contrast, our upside scenario assumes that GDP growth steps up and inflation remains below central banks’ target levels.
- The probability of our base case scenario is negatively impacted by the elevated levels of geopolitical uncertainty.
RATE CUTS STARTED AS INFLATION HAS COME DOWN
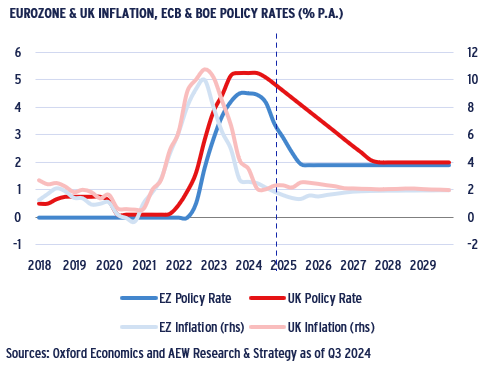
- Eurozone (EZ) headline inflation came in below the target at 1.8% y/y in Sep-24 with the UK expected to trail. However, UK CPI came down even more at 1.7% that month, down from 2.2% in August.
- Oxford Economics (OE) projects EZ inflation to decline by the end of 2025 to 1.6% – well below the ECB target inflation rate of 2.0%.
- As a result of lower inflation and weak growth, the ECB cut its main policy rate from 4.00% to 3.25% since June. Further cuts are projected to bring the policy rate at 2.00% by year-end 2025.
- UK inflation was projected to stay higher at 2.4% in 2025 than in the Eurozone, but since it came down more than expected in August this is likely to be adjusted downward.
- After cutting interest rates in August and November, the BoE is expected to make further cuts in 2025-27.
- Investors trading 10-year government bonds typically price in these anticipated declines in central bank policy rates.
GOVERNMENT BOND YIELDS PROJECTED TO TIGHTEN FURTHER
- As a result of lower inflation and expected central bank rate cuts, government bond yields are also expected to come in.
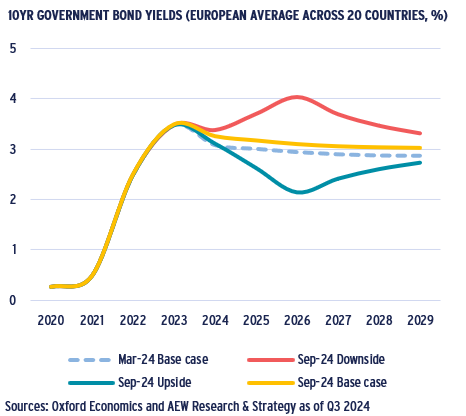
- Our 20-country European average 10-year government bond yield is expected to slowly tighten in by 50 bps to 3.0% over the next five years from its 3.5% peak of year-end 2023.
- This is slightly higher than the 2.9% expected in Mar-24, but close to the 3.4% pre-pandemic 20-year average.
- In our downside scenario, government bond yields are expected to peak at 4.0% bps in 2026. In the upside scenario, a 2.1% bottom level is assumed for 2026 returning to 2.7% in 2029.
- Given the high historical correlation between government bond yields and 5-year swap rates, lower bond yields have a positive impact on real estate investors’ costs of borrowing.
- Eurozone borrowing costs are now expected to come down to 3.6% by Q4 2025 while UK all-in borrowing costs are forecast to come down to 5.4% in Q4 2025.
BACKDROP – MIXED SIGNALS FROM PUBLIC & PRIVATE MARKETS
INDUSTRIAL OUTPUT AND RETAIL SALES REBOUND
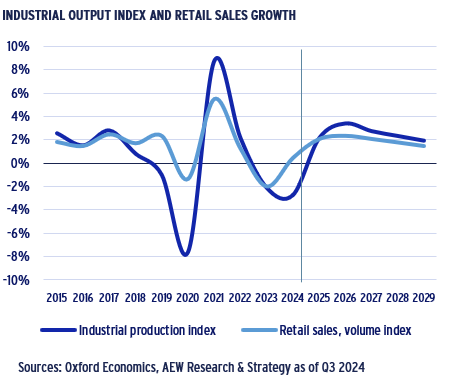
- Although Oxford Economics downgraded its Eurozone GDP growth forecast for 2025 to 1.1%, their forecasts imply that economic activity will improve in the coming years.
- Leading indicators suggest we are near a turning point and cyclical and structural tailwinds are expected to take over.
- As a result, industrial output growth across the Eurozone should gain momentum again in 2025-26.
- Retail sales projections suggest consumer spending will also gradually recover in 2025-26 as real income growth will pick up with inflation now firmly under control.
- At around 2% p.a. industrial output and retail sales growth projected for 2027-29 is back to pre-pandemic levels.
- These intermediate drivers will be supporting fundamental factors of both logistics and retailer occupier demand.
EUROPEAN REITS REBOUND leads PRIVATE MARKET RECOVERY
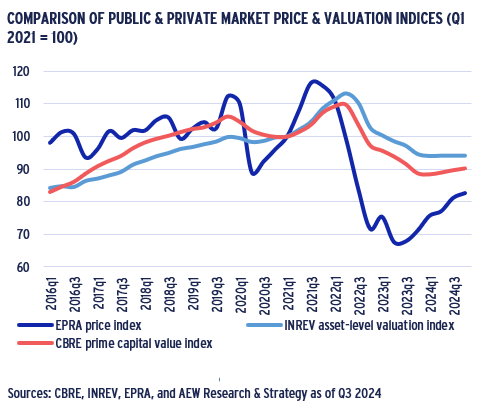
- European REITs led private real estate value indices down as they repriced sharply from their peak at year-end 2021 when inflation started increasing rapidly and rate hikes were expected.
- Over a two-year period, REIT prices came down 40% as concerns on debt levels and costs as well as sector specific concerns on offices impacted public market sentiment.
- After a three-quarter delay, private market indices from CBRE prime capital values and INREV asset level index based on appraised values also peaked and then declined by 20% and 17% respectively.
- Since mid-year 2023, REITs have rebounded by 22% while the two private real estate value indices stabilised (INREV) or showed marginal improvements (CBRE).
- This rebound for REITs should prove supportive for Europe’s non-listed real estate investors as REITs compete for acquisitions.
- Bond and equity issuance by European REITs has grown in 2024 from a very low base providing them with more capacity.
NEGATIVE NET FLOWS FOR RETAIL INVESTOR PROPERTY FUNDS REMAIN
- Despite the positive signals from the public markets, private real estate fund liquidity has remained challenging, while liquidity remains key to kick-start any future recovery in property values.
- Open-ended property funds have experienced high levels of redemptions since the rise in interest rates in 2022.
- Institutional fund data is unavailable and therefore we focus on public data on open-ended funds targeting retail investors.
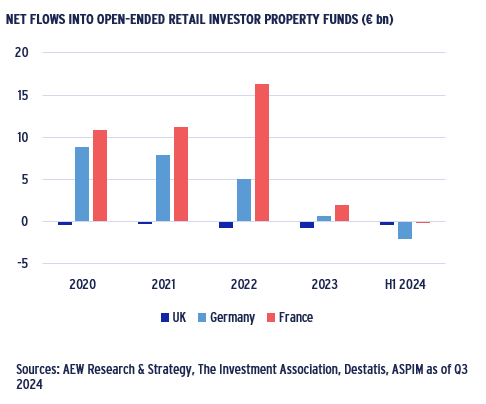
- UK open-ended funds stand out, as net flows have been negative since 2020, unlike in France and Germany where inflows were very strong post-Covid before the rise in interest rates.
- Cross-country comparisons remain challenging however due to differences, notably in terms of fiscal incentives & fee structures.
- Across Europe, net flows reduced significantly in 2023 and turned negative as a result of deteriorating performance, forcing some open-ended funds to gate and delay redemptions.
- These retail investor-focused funds represent around 30% of the volumes invested in France and 20% in Germany.
OCCUPIER MARKET OVERVIEW – MODEST VACANCY RATES SUPPORT RENTAL GROWTH
INCREASING OFFICE VACANCY RATE BUCKS THE TREND
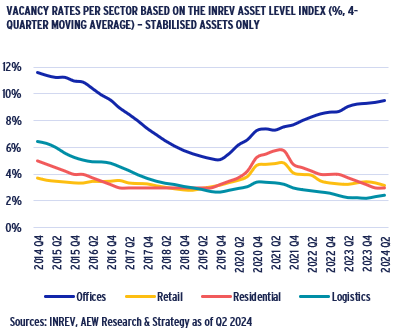
- Vacancy rates across European property sectors have been trending down since Covid, except for offices.
- Vacancy rates across property sectors are tracked with the INREV Asset Level Index (ALI) data as it shows performance of institutional investors’ real estate portfolios since 2014.
- At 9%, offices show the highest vacancy rate after excluding assets under (re-)development. Offices shows the largest and most enduring vacancy increase since the Covid pandemic.
- Pre-Covid office vacancy was at 5% at the end of 2019 while it is worth noting that office vacancy was near 12% back in 2014.
- Retail vacancy appears low at 3% but this is most likely reflective of the ALI high quality of assets reported by institutional investors.
- Residential vacancy is equally low at 3% but recorded an increase during Covid lockdowns as tenants moved out.
- The INREV logistics vacancy rate is the lowest across our sectors at 2% after steadily decreasing since the start of the Index in 2014.
LOGISTICS VACANCY PROJECTED TO COME DOWN FROM 5% PEAK
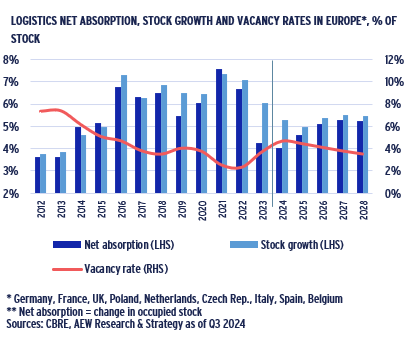
- European logistics net absorption in 2024 came in at around 18 million sqm, nearly half the record 2021 25 million sqm level.
- Peak net absorption levels of 2021-22 were driven by the surge of e-commerce activity during the pandemic, which has normalised.
- Developers responded to this increased 2021-22 demand with more supply, which is now subsiding as profitability is challenged by lower capital values and higher construction, labour and financing costs.
- The net effect of increasing supply and lower demand has pushed the average European logistics vacancy rate to a new peak of 5% as of year-end 2024, up from its record low of 2.5% in 2022.
- Going forward, new supply and demand are projected to be more balanced, which means that the CBRE logistics market vacancy rate is projected to come down gradually to 3.6% by 2029.
- This should prove to be positive factor for future rental growth across the core European logistics markets.
2024 IS PROJECTED TO BE PEAK FOR OFFICE VACANCY RATES
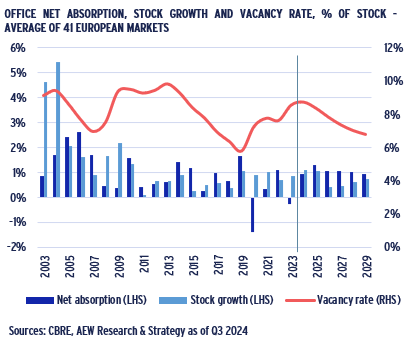
- As a result of remote working, office demand has decreased post-Covid. Many occupiers are renting smaller and higher quality spaces in fewer but more centrally located offices.
- Vacancy rates increased by 285 bps compared to pre-Covid 2019 levels to 8.7%, just ahead of the average since 2000 of 8%.
- Average office vacancy rate across the 40 European markets covered is expected to reach 8.7% as of year-end 2024.
- However, going forward vacancy is projected to come down from this recent peak by 190 bps to 6.8% as per year-end 2029.
- The recovery is driven by net absorption, combined with lower supply growth from 2025 and conversion of obsolete buildings.
- Bifurcation of the European office market has increased post-Covid. This is illustrated by higher vacancy rates in peripheral submarkets, like London Docklands and Paris Péri-Défense.
- Remaining concerns from investor focus on remote working even though more occupiers are starting to insist workers to return.
MARKET OVERVIEW – HIGHEST RENTAL GROWTH FOR PRIME OFFICES & RESIDENTIAL
HIGH QUALITY RETAIL SUB-SECTORS HAVE LOW VACANCY
- Over the past decade, retail has suffered from lower retailers’ space demand triggered by the growth in online sales. Also, more recently inflation has also impacted on consumers’ purchasing power.
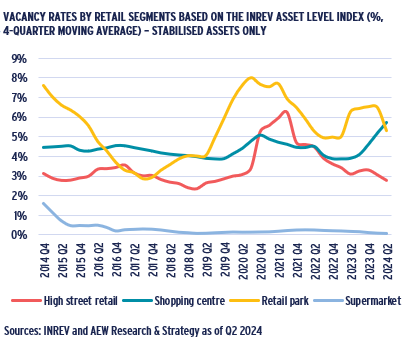
- Despite these challenges, INREV Asset Level Index (ALI) data shows that vacancy rates across retail sub-sectors currently stand between 3% and 6% - excluding supermarkets at near 0% vacancy.
- Since 2014, reported vacancy rates have remained relatively low with only minor increases during the 2020-21 Covid period.
- These low levels of vacancy are unlikely to reflect the overall retail market, since the ALI reports on over 1,000 high quality institutional assets, mostly in the Netherlands and the UK.
- The vacancy rate for shopping centers has increased since 2023 from 4% to 6% as the result of national retailers having to reduce their footprint and retaining space only in the most profitable locations.
- Based on the ALI data, the spike in the vacancy rate in high street retail to over 6% during Covid was short-lived.
- Retail park vacancy is more volatile due to a small sample size.
STRONGER DEMAND FOR RENTAL HOUSING DUE TO HIGH MORTGAGE RATES
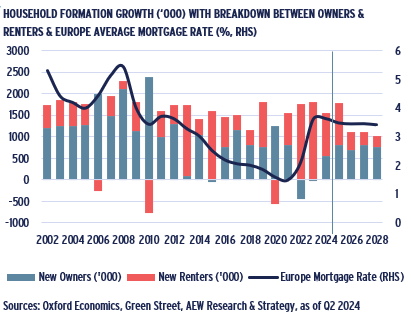
- Despite low population growth, positive household formation has driven demand for housing, especially in Europe’s cities.
- As a result, the long-standing shortage of housing has further intensified as home ownership has become less affordable due to higher mortgage rates and a drop in mortgage lending. In turn, this has pushed up the demand for rental housing.
- This trend is illustrated by the breakdown between owning and renting on the chart, which is highly tilted towards renting in 2022 and 2023 when the European mortgage rate more than doubled.
- Despite this disruptive increase from 1.5% in 2021 to 3.6% in 2023, mortgage rates are projected to stabilize around 3.4% across the five Eurozone countries and UK.
- Lower rates are expected to trigger a gradual rebound in European homeownership from 2025. However, it is still projected to remain lower than its historic average and below 65%.
- As a result, greater demand for rental housing will be supportive of rental growth across most European markets.
PRIME OFFICES COMES TOP, BEATING BEDS & SHEDS
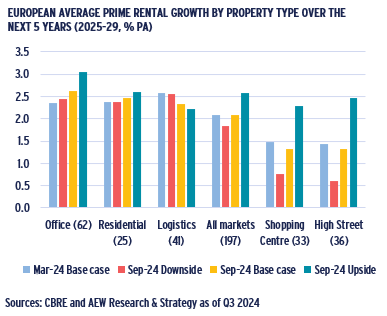
- Across sectors, prime rental growth is projected at 2.1% p.a. for 2025-28 in our base case scenario, unchanged from March 2024.
- In our downside scenario, rental growth across all sectors comes in at 1.8% p.a. while the upside is projected at 2.6% p.a. for the same 2025-29 period.
- Despite the unchanged base case all sector projection, there are some significant changes in the ranking.
- At 2.6% p.a. prime offices take top spot for 2025-29 forecasted rental growth, ahead of residential (2.5%) and logistics (2.3%).
- Both shopping centres and high street retail are expected to have below average 2025-29 rental growth of 1.3% p.a.
- In particular for offices, it is important to note that our forecasts focus on prime rents only. Rents for many secondary quality assets have been under pressure and might struggle to record growth.
- Investors are also increasingly pricing the challenging rental and operational outlook for non-prime assets.
CURRENT EUROPEAN CRE DEBT MARKET TRENDS
DEBT HAS BECOME ACCRETIVE AGAIN
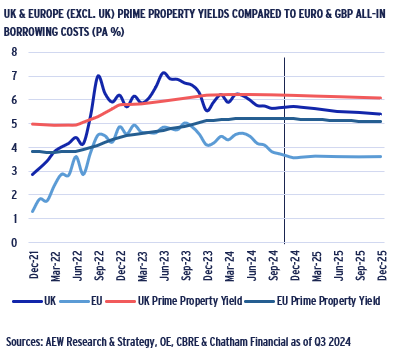
- Based on the latest data, CRE borrowing costs are projected to decline as well, albeit not to pre-2022 levels.
- Eurozone CRE borrowing costs are expected to moderately come down to 3.6% by Q4 2025, from 3.8% in Q3 2024.
- The UK swap rates remain higher, and UK all-in borrowing costs are forecast to come down from 5.7% in Q3 2024 to 5.4% in Q4 2025.
- UK all-in borrowing costs are 170 bps above the Eurozone’s since UK margins are 40 bps higher and UK swap rates 130 bps higher.
- Cross-sector prime yields in the Eurozone and UK are forecast to be at 5.1% and 6.1% by year-end 2025, respectively.
- Based on these data, CRE debt is accretive to equity investors.
- The projected 150 bps spread between the Eurozone’s prime yields and borrowing costs for year-end 2025 is more attractive than the UK’s spread of 70 bps.
- It seems reasonable to expect this more favourable lending environment to boost transaction volumes.
INCREASING SECTOR LOAN MARGIN DIVERGENCE
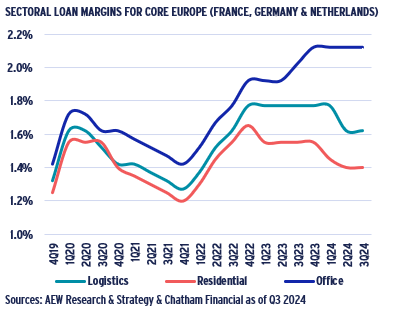
- After Q4 2022, margins, which had been relatively homogeneous between sectors, started to diverge, as lenders tightened residential and logistics margins, while office margins widened.
- Q2 2024 loan margins for core Europe (France, Germany & the Netherlands) stand at 212 bps, 162 bps, and 140 bps for the office, logistics, and residential sectors, respectively.
- Chatham Financial’s data is based on loan origination records sourced from its debt and hedging advisory business and filters for senior loans with LTVs at around 50%.
- After the initial Q1 2020 Covid shock, margins settled back down to their pre-Covid Q4 2019 levels over the subsequent two years.
- Only as inflation subsided in 2024 did lenders accept logistics and residential loan margins to return to below Covid peaks. Concerns on office fundamentals with lenders kept margins wide.
- Despite more normal margins, many investors and lenders are occupied with the remaining challenges of refinancing legacy debt positions, as quantified in our debt funding gap (DFG).
VINTAGE SPECIFIC LOAN MATURITIES SPREAD DFG OVER TIME
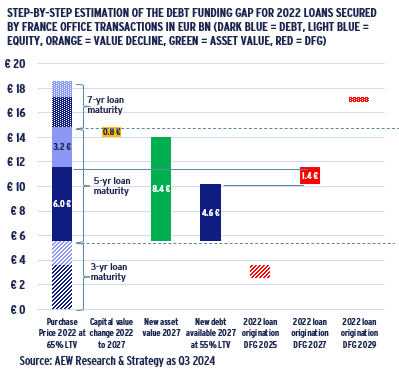
- New data has allowed us to expand and update our DFG methodology. To illustrate this, we provide the example of 2022 French office acquisitions and their funding as follows:
- Investors acquired EUR 18bn of French offices in 2022.
- These deals were financed using different loan terms, 30% of loans are assumed at 3-years, 50% at 5-years and 20% for 7-years as shown in the left stacked bar.
- 65% LTV is assumed across all three loan maturities.
- The chart focuses next on the 5-year (EUR 6bn) loans and its projected -9% value decline (EUR 0.8bn) at maturity in 2027.
- New debt volume is estimated at EUR 4.6bn or 55% LTV of the EUR 8.4bn new collateral value and DFG for 5-year loans is estimated at EUR1.4bn (EUR 6.0 bn– EUR 4.6bn) in 2027 in red
- DFGs of EUR 1.1bn in 2025 for 3-year loans and EUR 0.4bn 2029 for 7-year loans are calculated similarly and shown in shaded red.
- The cumulative DFG for 2022 French office financings is therefore EUR 2.9bn and spread over 2025, 2027 and 2029.
DEBT FUNDING GAP & PROJECTED CRE LOAN LOSS UPDATE
€86BN EUROPEAN DFG FOR 2025-27
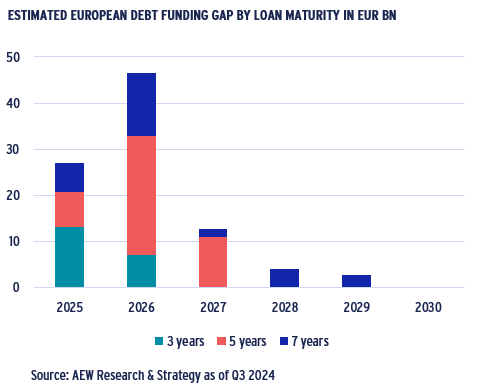
- Based on our updated methodology, we estimate a €86bn debt funding gap (DFG) for the next three years (2025-27). This is a reduction from the €99bn DFG we estimated in Apr-23 for 2024-26.
- This reduction is driven largely by pushing the period out by one year, especially as 2024 is nearly done and has a large DFG.
- Based on input from market experts, it is now assumed that 25% of loans maturing in both 2023 and 2024 will be extended by two years. This has pushed the 2025 and 2026 DFG up.
- These extensions allow loans to benefit from projected capital value improvements and are accounted for in our DFG estimate.
- Across the 2025-27 period, 5-year loan maturities constitute more than half of the DFG in the next three years at €44bn.
- Furthermore, 3-year and 7-year loan maturities constitute €20bn and €22bn, respectively.
- After 2027, our DFG consists exclusively of 7-year loans originated in 2021-23. This could increase on account of shorter-term loans originating after 2023, if capital values recover less than projected.
13% RELATIVE DFG DOWN FROM 17%, WHILE GERMANY REMAINS TOP
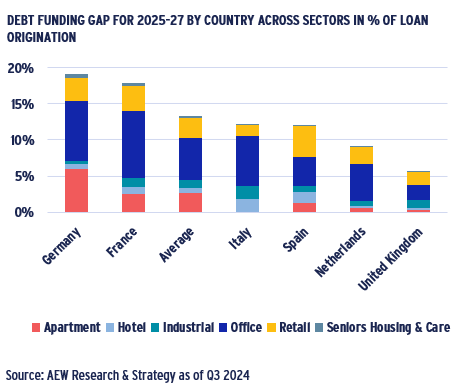
- The DFG can also be expressed as a percentage of the initial loan volumes, which shows both sectors and countries with the most severe refinancing problems.
- Based on our new DFG methodology, the relative DFG across Europe has come down to 13% of loan origination for the next three years (2025-27) from 17% for 2024-26 in April.
- Germany continues to rank top with a €31bn DFG representing 19% of all 2016-23 loan originations. This is the highest share of loans affected across all 20 countries covered.
- France’s DFG is estimated at €17bn which represents 18% of originated loans.
- Italian and Spanish figures are just below the average, at 12%.
- As before, the UK is on the lower end with a DFG of just €10bn, or 6% of original loan volumes.
- Across all countries, offices constitute the largest share of the DFG due to the larger volume of office transactions.
- The German residential-linked DFG is larger than elsewhere in Europe, due the sector’s large share in German deal volumes.
ESTIMATED LOSSES ON GERMAN LOANS RANK TOP
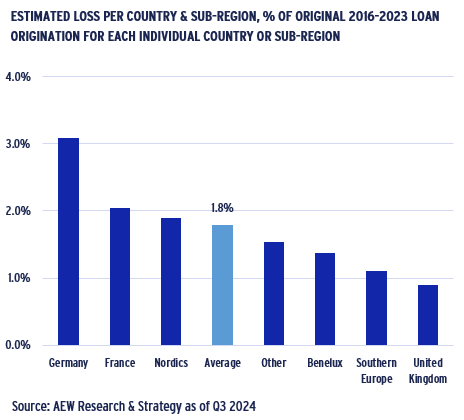
- Based on our analysis, 7.1% of CRE loans are estimated to default at maturity and losses for the 2016-23 vintages come in at 1.8%.
- Our estimate assumes that loan originations in a specific vintage and maturity segment default, if the LTV at refi is above 75%.
- Furthermore, we assume an enforcement-related cost of 25% of the estimated collateral value at the enforced sale, leaving 75% of proceeds to be recovered by the lender to cover its position.
- Our estimated loan losses are concentrated in the office and retail sectors, which suffered the largest repricing since 2016.
- Our latest 1.8% loss estimate is well below both 2.3% historical actual European CMBS losses and our previous estimate of 2.5%.
- Looking at the geographic breakdown, estimated losses for German collateral-backed loans in the 2016-23 loan vintages stand at 3.1% - notably higher than the overall 1.8% average.
- Based on the latest available data on European banks’ reserves, they seem sufficient to absorb these projected CRE losses.
MARKET OUTLOOK – IMPROVED SENTIMENT STARTING TO LIFT VOLUMES
BEDS & SHEDS LEAD STRONGEST QUARTERLY IMPROVEMENT IN SENTIMENT
- Q2 2024 shows the strongest all sector improvement in European managers’ sentiment since 2013 based on the Q2 2024 IPE Real Assets Expectations Indicator survey.
- The improvement in manager sentiment across all four sectors has picked up momentum since Q4 2022, with the biggest positive quarterly change for both residential and industrial.
- Manager sentiment for offices and retail are trailing behind but are also improving significantly.
- Our chart shows the net percentage (%) calculated as the difference between the share of real estate managers who believe property values would increase vs decrease over the next 12 months.
- Based on this, a value of 0 would indicate a neutral sentiment on the sector’s performance over the next 12 months.
- Past changes in managers sentiment can be tied to actual transaction volumes across European markets. Based on this improved sentiment, we expect 2025 volumes to recover.
DEAL VOLUMES STARTING TO PICK UP AS SENTIMENT IMPROVES
- Based on Q3 2024 year-to-date volumes of €114bn, we expect full year 2024 to come in at €170bn and 2025 at €200bn. This is ahead of 2023 €150bn transaction volumes across property types.
- This confirms that improved sentiment is pushing buyers and sellers to narrow their pricing expectations.
- Regardless, bid-ask spreads remain high, especially for offices despite steeper and faster value declines.
- Transactions proceed at reduced prices compared to many sellers’ original reserve price expectations, as lenders push for refinancings, and fund investors seek redemptions.
- Given that 2024 was better for stocks and bonds than property, we expect a continued reversal of the denominator effect as real estate has come in at below many investors’ target allocation.
- This might push more institutions to increase their investments to meet their long term optimal real estate portfolio allocations.
PRIME YIELDS TOPPED OUT IN 2024 AND PROJECTED TO TIGHTEN
- Prime yields stabilised across all five core prime sectors since Q1 2024 and our projections are mostly unchanged from the Mar-24 forecasts presented in our mid-year outlook.
This confirms that the post 2021 repricing has come to an end since higher interest and swap rates have stabilised and are no longer pushing prime property yields up.
With bond yields projected to come in, prime office yields are forecast to tighten most at 70 bps over the next five years, followed by logistics and shopping centres both at 40 bps.
Over the same period, prime residential and high street retail yields are projected to tighten 30 bps and 20 bps respectively.
This partially reverses the significant yield widening since 2021 especially for prime offices at 180 bps and logistics of 150 bps.
It should be noted that yield tightening for prime offices reflects investor preference for higher quality assets. Yields and returns for non-prime offices will be addressed later in the report.
MARKET OUTLOOK – PRIME OFFICES MOVE TOP
FRANCE MOVES TOP IN TOTAL RETURN RANKINGS
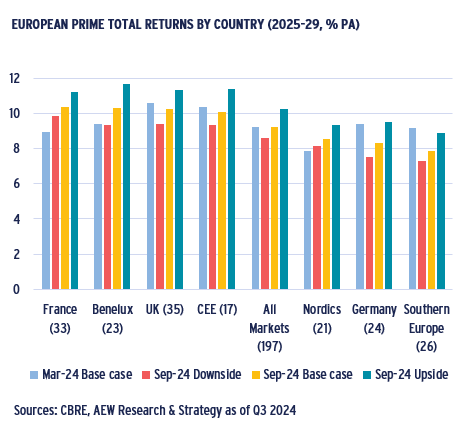
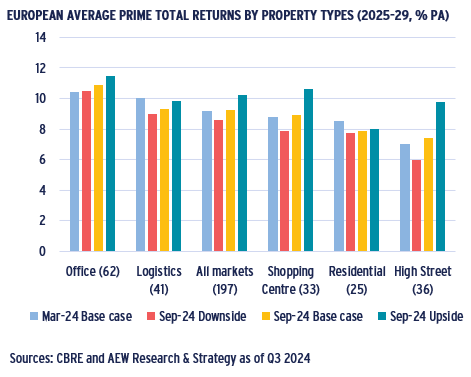
- The average total return across all markets in our base case scenario is projected at 9.2% p.a. for the 2025-29 period unchanged from our Mar-24 projections for the same period.
- French markets are projected to deliver the highest prime total return of 10.3% p.a., which is mostly driven by a larger number of office sub-markets in France compared to other countries.
- Despite recent widening of French government bond yields, our forecasts are still assuming property yield tightening by 2029.
- Benelux markets are ranked a very close second with a forecast return of 10.3% p.a., driven by forecasted yield compression.
- At 10.2% p.a. and 10.1% UK and CEE markets rank in third and fourth place in our total return projections partly driven by a higher number of logistics markets and higher rental growth.
- Both Nordics and German are below the European average prime return projections. Despite relatively strong rental growth forecasts, Southern European markets have modest projected yield compressions.
- Recent improvements in investor sentiment seems to imply that managers are not expecting significant further downward value adjustments making our 8-10% p.a. returns feel more realistic.
PRIME OFFICE REMAINS TOP RETURN SECTOR
- As mentioned, our base case prime returns projections remained unchanged across all countries at 9.2% p.a. for the 2025-29 period compared to our base case from Mar-24 for the same period.
- Prime office markets are projected to have the highest returns of any sector at 10.9% p.a. over the next five years. This is due to their recent repricing, solid projected rental growth and yield tightening.
- Prime logistics come in second place with returns of 9.3% p.a. on the back of lower rental growth and yield tightening projections.
- As geopolitical uncertainty remains top of mind for many investors, we should consider that our latest downside scenario shows returns at 8.6% p.a. across sectors while our upside scenario indicates 10.2%.
- There are again two drivers impacting our projections:
- Firstly, 2023-24 repricing has pushed yields to reach a peak.
- Second, projected property yield tightening by year-end 2029 has remained unchanged despite the latest government bond yield projections coming in a bit higher.
PROJECTED CAPITAL RETURNS IN LINE WITH POST-GFC
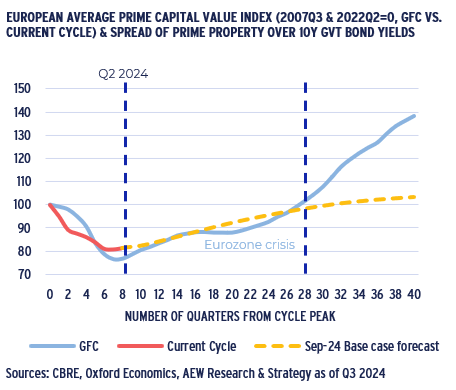
- Based on feedback that our forecasted returns seem unrealistically optimistic, we place our projected base case recovery in the historical context of capital values post global financial crisis (GFC).
- GFC triggered a near -25% reduction in prime capital values across all European sectors, while the current downturn recorded a more modest -20%. In both cases the downturn lasted eight quarters.
- In our current base case scenario, we project capital values to return to their Q2 2022 level after seven and a half years by Q4 2029.
- This is similar to the 7-year cycle shown in GFC starting in Q3 2007.
- The post-GFC recovery benefitted from interest rates that were gradually pushed to ultra-low levels following the Eurozone crisis.
- In fact, the pace of post-GFC recovery sped up significantly after those near-zero interest rate came in.
- Given the current long term outlook for economic growth, inflation and bond yields, this is not expected for the current recovery.
PRIME EXPECTED TO OUTPERFORM SECONDARY DESPITE STRONGER INCOME RETURNS
SECONDARY RENTAL GROWTH JUST BEHIND PRIME, EXCEPT FOR RETAIL
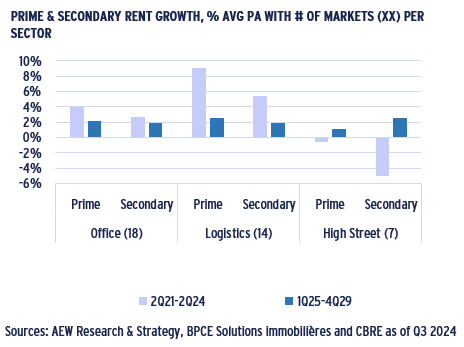
- Data on secondary rents and yields for European office, logistics and high street retail markets from BPCE Solutions Immobilières going back 16 quarters offers some new comparison with prime.
- Consistent data is available across 39 markets in seven countries.
- Unsurprisingly, actual rents over the last 3.5 years have been strongest in prime and secondary logistics at 9% and 5.5%, respectively.
- Retail has recorded rental declines of -0.6% and -5.1% over the same period.
- Despite popular belief, secondary office rents recorded rental growth of near 3% and are projected at 1.9% pa over the next five years, not far behind prime at 2.2% over the same future period.
- In a notable exception, secondary high street retail rents are projected to increase at 2.6% pa, more than double the 1.2% pa forecast for prime.
SECONDARY YIELDS PROJECTED TO BARELY TIGHTEN
- Switching to yields, we note the following historical trends:
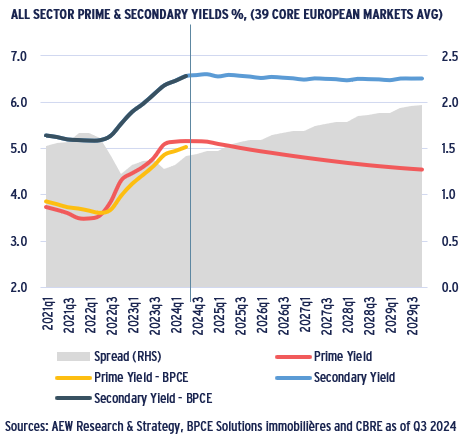
- Across our 39 European markets, CBRE prime yields (red) and BPCE (yellow) are highly correlated.
- BPCE prime (yellow) and secondary yields (black) are highly correlated, but the excess spread (grey) is not stable.
- In fact, it seems counterintuitive that secondary yields widened out less than prime yields post 2022 rate hikes.
- Our econometric models result in a 10 bps tightening of secondary yields to 6.5% by year-end 2029, while our base case prime yield projections show a 70 bps tightening over the same period.
- This means that the excess spread of secondary over prime yields is expected to reach nearly 200 bps, higher than at any time during the limited historical period at our disposal.
- If there is going to be a more broadly based recovery in the next 3-5 years, it would make sense that the excess spread between secondary and prime yields would come down.
- Our current projections for secondary yields could prove to be too conservative, especially once a prime recovery triggers scarcity and repricing and forces investors into secondary segments.
PROJECTED SECONDARY RETURNS TRAIL PRIME
- Based on the above rental growth and yield projections, we can compare total returns across sectors.
- Across our 39 covered sectors, prime returns are projected at 9.7% p.a. compared to 9.1% p.a. for secondary. However, 6.7% secondary income returns offer more certainty to investors than prime at 5.0%.
- In other words, prime returns are more contingent on our base case projected yield tightening producing capital returns.
- For secondary markets virtually no yield tightening is assumed and little capital appreciation is expected as a consequence.
- This is especially true for offices, where secondary market returns are projected at 9.7% pa with 7.2% pa coming from the income return.
- High street retail again offers a slightly different picture with similar capital returns for prime and secondary, but a 140 bps higher income return p.a. for secondary compared to prime.
- For those who are both skeptical on future yield tightening and able to accept a higher operational risk, secondary markets might offer a more attractive opportunity than prime, based on our analyses.
MARKET OUTLOOK – THE RISE OF THE ALTERNATIVES
SHARE OF ALTERNATIVE SECTORS SETS NEW RECORD, LED BY HOTELS
- At 18% of total European real estate investment volumes, alternative property types have set a new record after trending upwards, both post-Covid from 8% in 2021 and long term from 7% in 2008.
- Hotels remain the largest alternative sector, representing 11% of total volumes as of 2024, while data centres appear well-positioned to benefit from the strong growth going forward.
- Other alternative property types include healthcare (hospitals, care homes), self-storage and other smaller niche sectors (co-living/intergenerational housing).
Investors and asset managers are considering alternative business models than the traditional commercial lease, ranging from management agreements to joint-ventures with specialist operators. - Investors are increasingly looking at alternative property types to diversify their portfolios, as they benefit from strong fundamentals. This also allow them to reposition obsolete assets to alternative uses.
ALTERNATIVE YIELDS GETTING CLOSER TO TRADITIONAL SECTORS’
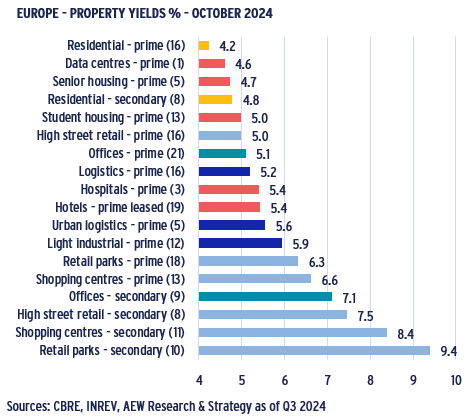
- Due to strong investor interest, alternative sectors’ yields (red) are now below or on par with core property types – residential (yellow), retail (light blue), offices (turquoise blue) and logistics (navy blue).
- The chart shows October 2024 yields of the traditional core and alternative property types. The number in brackets indicate how many European markets are included in each average.
- These yields confirm that alternative property types have become fully integrated into the institutional investable universe.
- This trend has accelerated post-Covid with increasing concerns around the fundamentals of the office market, traditionally the largest property sector in terms of volumes invested.
- Investors’ focus on risk and the associated need to diversify their existing portfolios has further increased alternative sectors’ appeal.
- This is also reflected in the breakdown of the INREV Fund Level Index by sectors. The share of alternative property types increased from 10% on average in 2010 to 16% in 2024.
- In parallel, the share of traditional core sectors decreased, with offices from 28% to 22% in 2024, in third position behind logistics (26%) and residential (23%).
ALTERNATIVE YIELDS STILL OFFER SPREAD OVER TRADITIONAL SECTORS
- Purpose-built student accommodation (PBSA) is one of the alternative property types which has experienced strong investor appetite over the past few years driven by strong fundamentals.
- PBSA’s resilience to economic shocks and the sectors more established pan-European operators have helped.
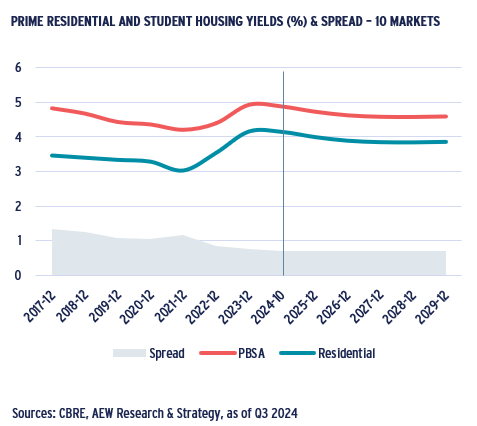
- A comparison of student housing yields to prime residential yields across ten European markets shows that the yield spread between the two sectors has reduced from 130 to 70 bps on average.
- This positive excess yield spread reflects the operational risks associated with PBSA.
- Prime European residential yields are forecast to compress by 30 bps on average over the next five years, from 4.2% to 3.9%.
- A similar trend of yield tightening can be expected for prime PBSA yields, assuming a stable spread.
- Investors have been attracted to PBSA’s higher returns as an alternative to management intensive traditional multi-lets by acquiring or signing a master lease with a specialist operator.
RELATIVE VALUE ANALYSIS - MOST EUROPEAN MARKETS ATTRACTIVE
166 BPS OF RELATIVE VALUE SPREAD FOR 2025-29
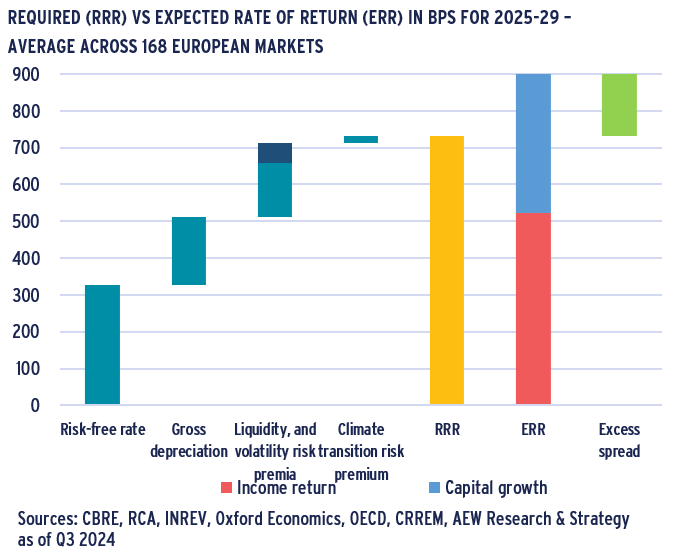
- Our risk-adjusted return approach is based on a comparison of the required rate of return (RRR) and the expected rate of return (ERR) over the next five years.
- To reflect recent volume declines we have updated our liquidity premium estimate to be more reflective of short-term trends.
- For the 168 European market included in this relative value analysis the 2025-29 average RRR is projected at 7.3% p.a. and ERR is estimated at 9.0% p.a. (with a breakdown of 5.2% for income returns & 4.8% for capital growth).
- Despite a higher liquidity risk premium, the risk-free rate of 3.3% remains the largest component of the RRR.
- This means that the ERR has a significant positive excess spread of 166 bps over the RRR.
- This implies that property investors should be well compensated for the risks across European markets over the next five years.
- Next, each individual market can be qualified as attractive, neutral or less attractive by comparing its ERR and RRR.
RESILLIENCE IN DOWNSIDE SCENARIO
- Our positive relative value outlook for 2025-29 in the base case is consistent with our 2024 mid-year outlook.
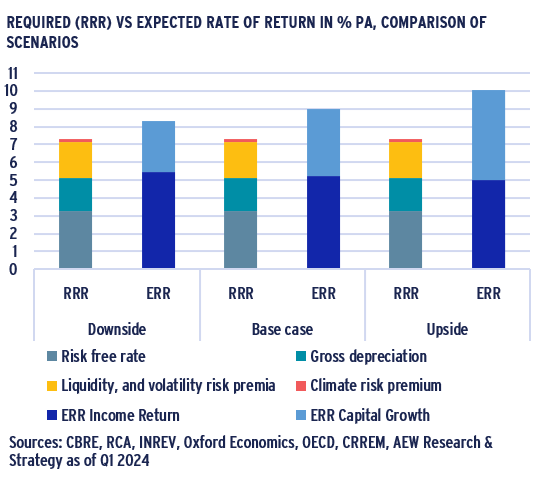
- Our base case ERR for 2025-29 is projected at 9.0% p.a., a small improvement from our mid-year outlook ERR (2024-28) of 8.7% p.a. This is partly due to losing 2024 in the forecast period.
- However, political uncertainties make non-base scenarios more relevant.
- If trade barriers and other restrictions become the main policy focus, higher inflation and lower GDP growth should shift our focus to our downside scenario.
- However, the downside relative value comparison shows resilience as it still implies 100 bps of excess spread between ERR and RRR.
- However, if the new US government focuses more on the settlement of armed conflicts, it could trigger higher GDP growth and lower inflation.
- In this upside scenario, excess spread moves up to 270 bps from 170 bps in the base case.
OFFICES RANKS TOP AS SECTOR
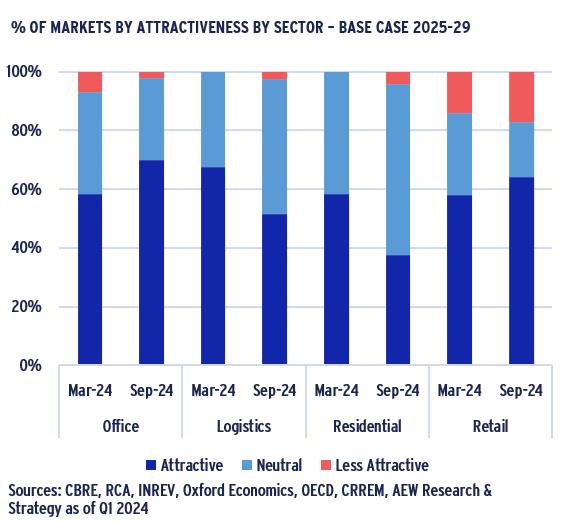
- In our current base case, investors should meet or exceed the RRR in 92% of all 168 markets, marginally down from 93% in Mar-24.
- Of the 168 markets covered, 99 are classified as attractive (down from 101), 55 markets as neutral (stable), and only 14 as less attractive (up from 12).
- Despite the limited change in overall classifications, offices move top with 30 classified as attractive, 12 neutral and one in the less attractive category.
- Logistics is the runner-up in our relative value sector ranking, with 19 markets classified as attractive vs 17 neutral with one market in the less attractive category.
- Only 8% of the markets covered remain classified as less attractive making it relatively easier to source attractive individual deals.
- Retail saw a small increase of the number of markets classified as less attractive from 9 to 11 since our mid-year outlook.
RELATIVE VALUE ANALYSIS - SOLID ACROSS THE BOARD
BENELUX TAKES TOP COUNTRY RANKING
- Across all 20 countries covered, our Sep-24 projections imply that investors should meet or exceed the RRR in over 92% of markets, down from 93% in Mar-24.
- Across the Benelux, 18 of 20 markets are classified as attractive with the two remaining markets neutral.
Benelux is just ahead of France, where our relative value analysis also shows 18 attractive markets, with three marked as neutral. - The UK has moved into third position with only one less attractive market out of 30, after ranking top in the last two years. Nordics are close behind with one less attractive out of only 21 markets.
Germany shows more attractive markets than the European average while Southern Europe and CEE continue to trail the European average. - Both of these sub-regions are impacted by higher risk-free rates and therefore have lower excess spreads of ERR over RRR.
- Only 14 of 168 (or 8%) market segments covered are classified as less attractive. This is up from 7% in Mar-24.
SELECTIVE MARKET TARGETING STILL NEEDED
- As before, sector and country specific classifications hide market segment specific results, which can be reviewed in more detail.
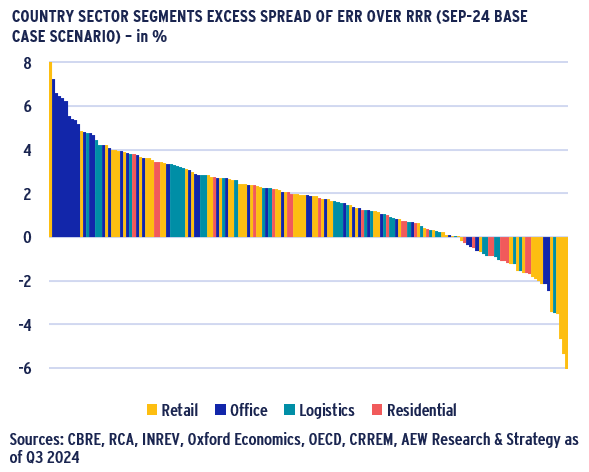
- Selectivity in allocation is needed since the range of excess spreads across our European market coverage of 168 segments remains between minus 600 bps and a positive 800 bps.
- Some noted over-achievers are Paris high street, Dublin and Amsterdam office. On the other hand, we note Budapest logistics and offices as showing negative excess spread.
- Given that the average excess spread is nearly 170 bps, this means that some markets show excess spreads at near five times, while others are showing near minus three times the European average.
- This wide range of individual markets’ excess spreads highlight the need for an experienced manager’s ability for careful selection of sub-markets (and individual deals) at this point in the cycle.
- Finally, we aggregate 168 submarkets on a country and property type to rank them by segment across the core European countries.
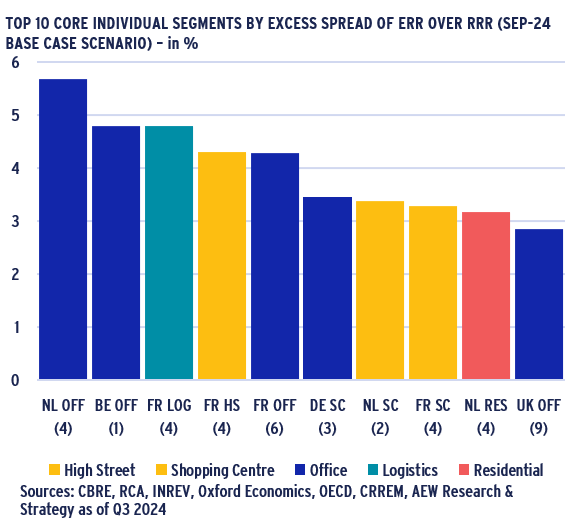
OFFICES FOUR OF TOP TEN MARKET RANKING
- Offices stand out in our latest ranking of market segments based Relative value excess spread (bps of ERR > RRR) with 4 of the top 10 even if all core property types are included.
- Dutch offices rank top followed by Belgian offices, French logistics, French high street retail and French offices closing out the top 5.
- German, Dutch and French shopping centres are in 6th, 7th and 8th positions followed by Dutch residential and UK offices to complete our full top ten ranking.
- Top ranked Dutch office markets have an excess spread of near 570 bps – well over triple the European average of 167 bps.
- France is the most featured country in our excess spread ranking each with four sectors followed by Netherlands with three sectors and Belgium, Germany and UK with one sector each.
- With only two in our top ten ranking, it seems that the popular beds and sheds theme across European markets is fading a bit. This is due to recent yield tightening leaving less upside for later.
- Recent yield tightening in these two popular segments might have pushed down ERR reducing the spreads over RRR.
This material is intended for information purposes only and does not constitute investment advice or a recommendation. The information and opinions contained in the material have been compiled or arrived at based upon information obtained from sources believed to be reliable, but we do not guarantee its accuracy, completeness or fairness. Opinions expressed reflect prevailing market conditions and are subject to change. Neither this material, nor any of its contents, may be used for any purpose without the consent and knowledge of AEW. There is no assurance that any prediction, projection or forecast will be realized.


