IS THE WORST OF THE REFINANCING CHALLENGE BEHIND US?
- With inflation coming back down, the Riksbank of Sweden led the widely anticipated central bank rate cuts in May followed by multiple ECB cuts and the August BoE move. As the macroeconomic outlook remains muted, further rate cuts are expected.
- Feedback from investor clients and others on our previous debt funding gap (DFG) analyses has been broadly positive. With some additional transparency and market feedback we update our DFG estimate and place it in its proper context.
- The most frequently asked question was: Is the worst of the refinancing challenge (finally) behind us?
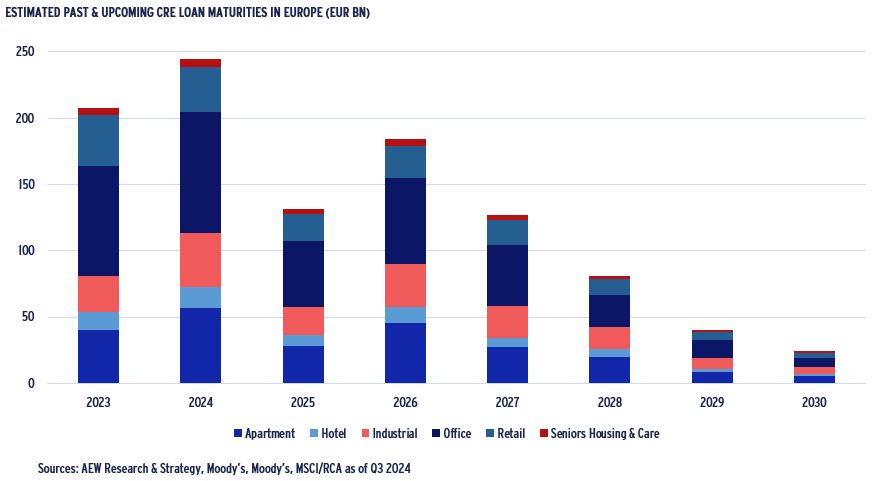
- In order to answer this question, for the first time we have estimated recent and upcoming CRE loan maturities across Europe, based on new data from Moody's. Loan maturities in 2023 and 2024 are estimated at EUR 210 and 240bn, respectively. These are now mostly behind us, even if maturity extensions linger.
- Loan maturities in 2025 and beyond are projected to be lower than 2023-24. This could imply that most of the refinancing challenge is now behind us. However, the volume of loan maturities is not directly tied to borrowers’ ability to refinance them.
- In short, a closer look is needed to assess how hard it will be to refinance the upcoming (albeit lower) CRE loan maturities.
BORROWING TERMS IMPROVE AS REFINANCING CHALLENGE EASES
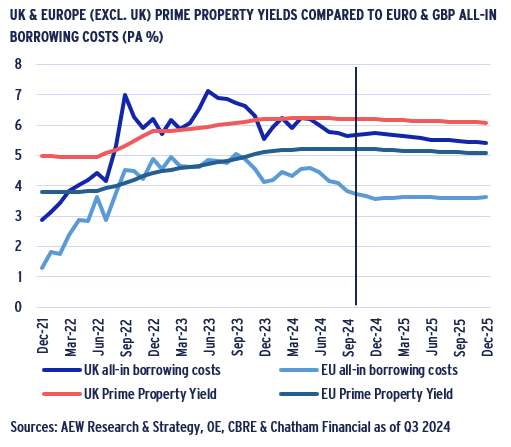
- Even as inflation came down broadly as expected, 5-year Euro swap rates came in less than previously projected. Despite the ECB rate cut, CRE borrowing costs in the Eurozone are forecasted at 3.6% by year-end 2025 down from 4.9% in Q3 2023.
- UK borrowing costs are forecasted to come down to 5.4% by year-end 2025 from its 7.1% Q2 2023 peak.
- Regardless, the positive spread between prime yields and debt costs has become accretive again in the Eurozone since Q4 2023 and Q2 2024 for the UK. This availability of accretive debt should allow investors to become more active.
- Our in-house private loan data also shows a reversal in CRE borrowing costs in 2024, which is confirmed by recent pricing on secondary trading in CRE bonds at 4.2% having come down in line with CRE borrowing costs.
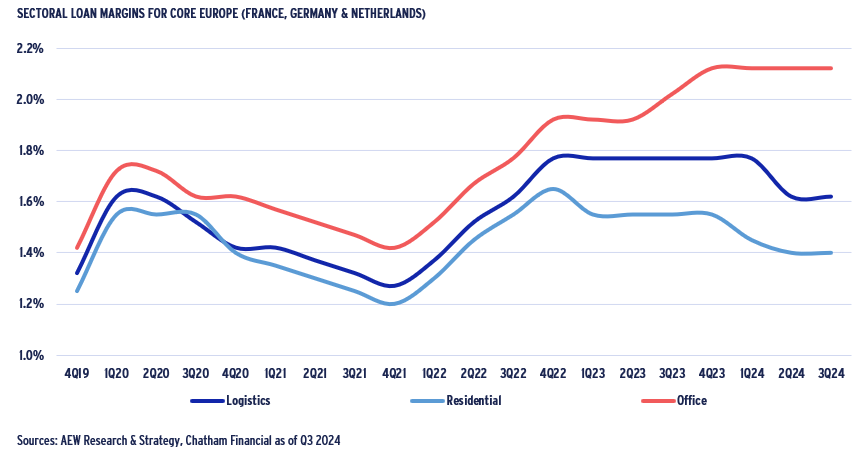
- Even as margins and all-in borrowing cost come in, lenders are increasingly differentiating in pricing loans secured by assets in different sectors. In that respect, office loans stand out as having higher margins than logistics and residential loans.
- In addition, there are initial indications that LTVs are moving back up and covenant restrictions are becoming less restrictive as lenders become less concerned on further downside risk and compete more actively for business.
- Despite these improved terms for CRE borrowers, many still face issues with the refinancing of legacy loans due to the historical reduction in collateral values. Our 20-country European debt funding gap (DFG) estimate is €86bn for 2025-27.
- Our latest €86bn DFG estimate implies that nearly 13% of maturing European real estate loan volumes are expected to be difficult to refinance, as a share of loans originated in 2016-23.
- Since the 13% is lower than our Apr-24 estimate of 17% for 2024-26, it reflects easing of the refinancing challenge in Europe. Our latest DFG estimate is based on more precise loan vintage specific assumptions and market input on maturity extensions.
- Compared to the 13% European average estimate, Germany and France still face a relatively bigger challenge at 19% and 18%. In addition, we note that apart from equity injections, debt-on-debt has also been used more widely to bridge the DFG.
- As before, not all hard-to-refinance loans are expected to trigger a default or loss for the lender. The impact on various sectors depends on the precise timing, extent of collateral and rate distress for each country across each of the 2016-23 loan vintages.
- Based on our latest DFG, 7.1% of €700bn 2016-23 CRE loan originations are estimated at risk of default and their associated losses are projected at 1.8%. These latest projections are below 2.3% European CMBS loan losses and previous 2.5% estimate.
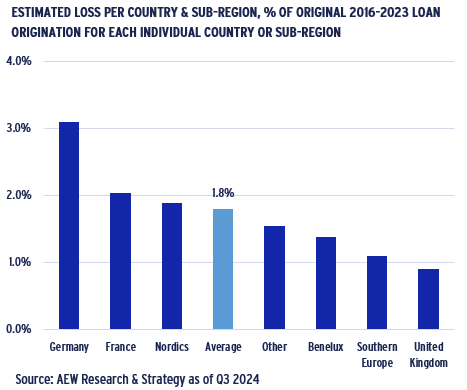
- Across sectors, estimated losses for retail-backed loans are near 6%, nearly triple the European average. Also, on a country level, German loans are estimated to have a 3% loss, near double the European average.
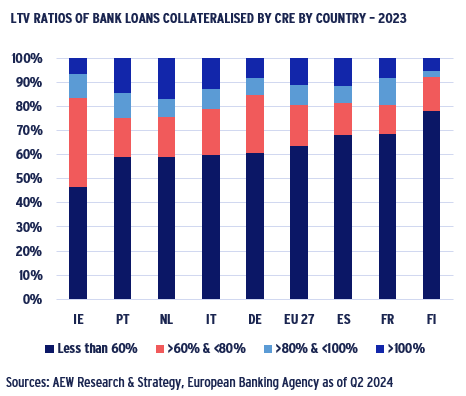
- Year-end 2023 EBA data is mixed on lenders’ ability to absorb these potential losses. On the positive side, only 11% of EU banks’ CRE loans are in the +100% LTV category.
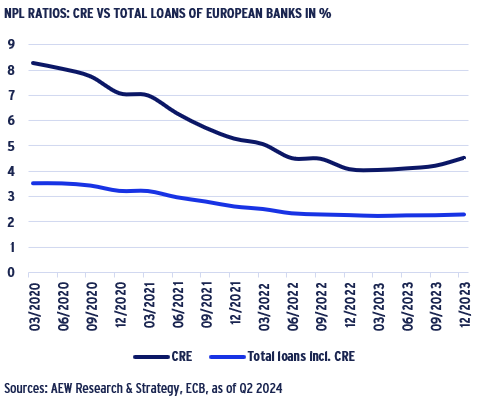
- European banks’ NPL ratio for CRE loans has been trending downwards from over 8% in 2020 to 4% in early 2023. However, in Q4 2023 it edged up to 4.5% due to the falling collateral valuations, partly explained by loans secured by US CRE.
- Finally, European banks’ low CRE NPL and high coverage ratios are in turn starting to result in more attractive loan terms for borrowers. This should facilitate the emerging rebound in European capital values and transaction volumes.
CURRENT EUROPEAN CRE MARKET TRENDS
2023 CHANGE IN OUTSTANDINGS LOANS FOR FUNDS LARGER THAN BANKS
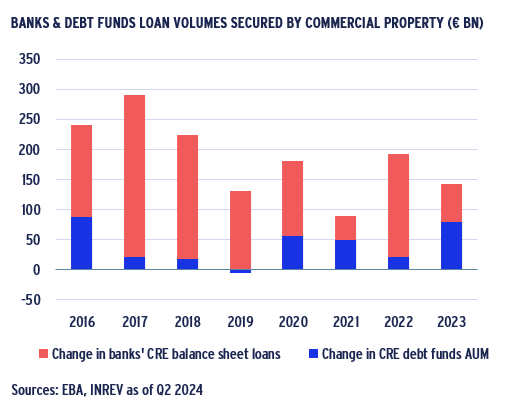
- The European commercial real estate (CRE) debt market has been dominated by banks taking around 85% of outstanding CRE debt.
- However, EBA data on the banks’ balance sheet highlights a decrease in their CRE lending in 2021-23 compared to 2016-18.
- This decline is likely due to a focus on loan restructurings, stricter bank regulations and the lack of investment activity.
- Surveys confirm debt funds’ modest share of annual lending so far. But their share has been increasing. In the UK, Bayes’ survey shows debt funds’ share increased from 12% in 2019 to 20% in 2023. Also, in France IEIF reports an increase from 7% in 2019 to 10% in 2022.
- As a proxy for a broader European-wide CRE debt fund lending, we use INREV data on the €407 bn AUM of 96 European debt funds.
- Similar to the EBA approach for banks, we use the change in AUM year-on-year as an estimate of funds’ lending activity for each year.
- Net CRE lending by debt funds overtook banks in both 2021 and 2023. As banks face regulatory pressure to reduce their CRE exposures further, debt funds are expected to increase their share.
DEBT HAS BECOME ACCRETIVE AGAIN, ESPECIALLY IN EUROZONE
- Based on the latest data, both Eurozone and UK 5-year swap rates have come down and are forecast to further decline over 2025.
- As a result, CRE borrowing costs are projected to decline as well, albeit not to pre-2022 levels.
Eurozone CRE borrowing costs are expected to moderately come down to 3.6% by Q4 2025 from 4.0% in Q3 2024. - The UK swap rates remain higher, and UK all-in borrowing costs are forecasted to come down from 5.7% in Q3 2024 to 5.4% in Q4 2025.
- UK borrowing costs are 170bps above the Eurozone’s since UK margins are 40bps higher and UK swap rates 130bps higher.
- Cross-sector prime yields in the Eurozone and UK forecasted to be at 5.1% and 6.1% by year-end 2025, respectively.
- Based on this, CRE debt is accretive to the equity again.
- The projected 150 bps for year-end 2025 between the Eurozone’s prime yields and borrowing costs is more attractive than the UK spread of 70bps.
- It seems reasonable to expect this more favourable lending environment to positively affect transaction volumes.
LATEST LTVS COMING DOWN ACROSS REITS, FUNDS & LOANS
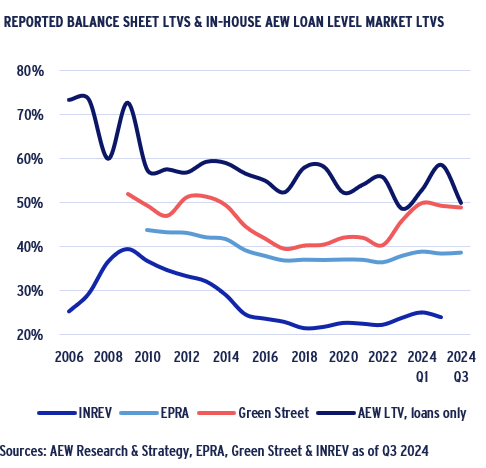
- Lenders’ risk appetite is not only expressed in pricing, but also in loan-to-value (LTV) ratios.
- The data shows a stabilisation in REITs’ (i.e. listed real estate companies) balance sheet LTVs and in INREV’s private real estate fund LTVs confirming a persistent gap in the last 10 years.
- The latest figures report Q2 2024 INREV LTV of 24% and the Q3 2024 EPRA and Green Street LTV at 39% and 50%, reinforcing the reality of higher leverage in the public markets.
- Similar to our Aug-23 report, Green Street data shows a stronger upward trend for REIT LTVs than the EPRA data. This is due to their definition of LTV, which includes unfunded liabilities and is highly sensitive to the equity valuations.
- Our in-house loan-level LTV market data shows a decline in Q3 2024 to 50% after a surprise increase in Q3 2023 to 59%.
- Our loan level data disregards non-leveraged transactions. These latest results confirm the historically higher and more volatile loan level LTV, ranging between 52% and 60% over the last 10 years.
LOANS AT HIGHER RATES ON A WIDE LTV SPECTRUM
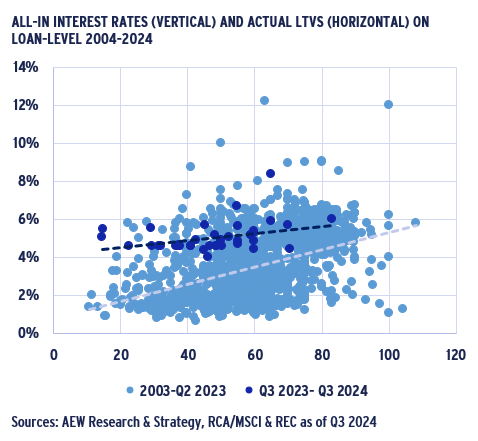
- We updated our in-house granular loan by loan database with loans originated since Aug-23 to bring our data set close to over 1,553 loans from our three sources – AEW lending and finance platforms, RCA/MSCI and REC.
- As before, our data goes back to 2003 and we estimate that it covers about 10% of acquisition debt origination since 2010 and is believed to be representative for terms in the overall market.
- Our scatter chart data shows that the loans originated in the last four quarters are spread across LTV spectrum: from 15% to 83%.
- New loans’ all-in interest rates are consistently higher with an average rate of 5%. This compares to an average of 3.5% on all other loans in the database.
- As before, our granular loan level data allows for a more precise interrogation of the impact of external market shocks, like the recent increase in the 5-year swap rates.
- It also allows for some comparisons with other sources, like Green Street and Chatham Financial.
ALL-IN RATES DOWN FROM THEIR RECORD HIGH IN H2 2023
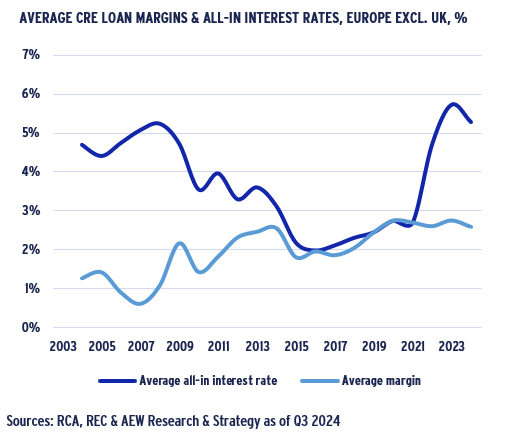
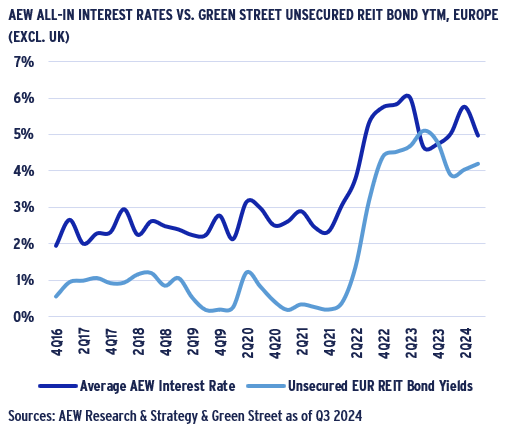
- Our granular loan-by-loan data confirms that all-in interest rates in Europe excl. UK came back down to 5.3% as of mid-2024. This is 40 bps down from its record high of 5.7% in 2023.
- This follows a period of extremely low interest-rate environment between 2016-21 when the all-interest rate was primarily comprised of the margin with base rate near zero.
- High all-in interest rates of the current repricing cycle (2022-24) made debt unattractive for many leveraged equity investors. As a result, 2023 acquisitions volumes were half 2022 levels.
- Transaction volumes are expected to increase, should the reversal in the cost of debt trend continue as leveraged buyers will find debt accretive again.
- Leveraged investors with legacy financings from the pre-pandemic period face lower collateral values and increasing debt service when refinancing, limiting their ability to take advantage of repricing in the real estate investment markets.
CRE BOND YIELDS AND LOAN RATES DOWN FROM 2023 PEAKS
- CRE loan and bond costs went up by 370bps and 490bps, respectively, since Q4 2021 as we compare market level secured mortgage interest rates to unsecured REIT bond yields.
- Quarterly data shows a peak of 6% in all-in borrowing costs in Q2 2023 with subsequent volatile path towards 5% in Q2 2024.
- This volatility is likely due to the smaller number of loans originated in the period.
The bond yields are reflective of secondary bond pricing in the market with a peak of 5.1% in Q3 2023 and a subsequent decrease to 4.2% in Q2 2024. - The near 200 bps gap between bond yields and private loan costs observed in the pre-pandemic period has narrowed significantly as bond markets repriced risk more.
- The data reconfirms the high degree of correlation between the two data series on longer periods.
- Both loan rates and bond yields remain elevated relative to the pre-pandemic era as central bank policy rates are still higher as inflation and geopolitical uncertainties remain.
LOAN MARGINS DIVERGE ACROSS SECTORS
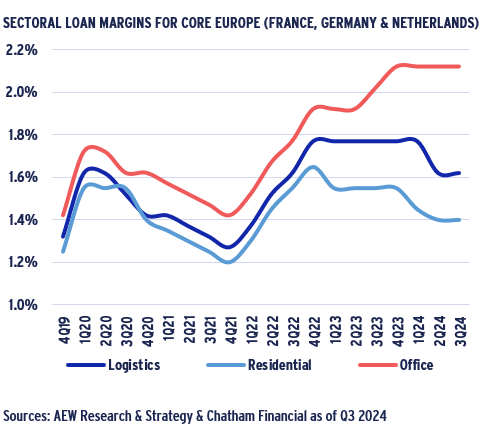
- After Q4 2022, the relatively stable order of loan margins between sectors was discontinued as residential and logistics margins tightened, while office margins continued to widen.
- Q2 2024 loan margins for Northern Europe (France, Germany & the Netherlands) stand at 212bps, 162bps, and 140bps for the office, logistics, and residential sectors, respectively.
- Chatham Financial’s data is based on loan origination records sourced from its debt and hedging advisory business and filters for senior loans with LTVs at around 50%.
- After the initial Q1 2020 Covid shock, margins settled back down to their pre-Covid Q4 2019 levels over the subsequent two years.
- However, central bank rate hikes triggered CRE margins to surpass their Covid peaks for most of 2023.
- Only as inflation returned to normal in 2024 did logistics and resi loan margins return to below Covid peaks, while widening office margins reflect its multi-faceted challenges.
FINANCIAL COVENANT EASING TO PUSH UP LENDING AND DEAL ACTIVITY
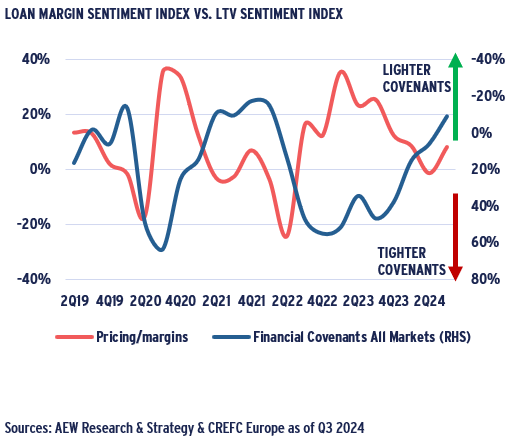
- The latest Q3 2024 CREFC Europe data shows that financial covenant tightening peaked in 4Q 2022 and has eased since.
- Lender’s sentiment on margins & pricings has been deteriorating from Q1 2023 with a mild reversal in Q3 2024.
- With margins contracting, lenders’ need to compete with each other on pricing and other terms to attract business.
- This pricing/margins trend has partially reversed in Q3 2024, but whether this is sustained will depend on equity sentiment in the investment market and the outlook for rate cuts.
- Similarly, financial covenant restrictions (LTV and ICR) peaked in Q4 2022 at 55% and have since steadily eased to -9% in Q3 2024. As before, LTV covenants were replaced with the average of LTV and ICR covenants as they are highly corelated and the combination allows for a longer historical analysis.
- This recent data reconfirms that when lenders become more cautious, financial covenants become stricter and margins go up.
- Based on this it would be reasonable to expect further margin stabilisation and covenant easing as long as central banks continue to cut rates assuming new economic data supports it.
ACTUAL LOAN LTVs MOVE BACK UP REFLECTING COVENANT SENTIMENT
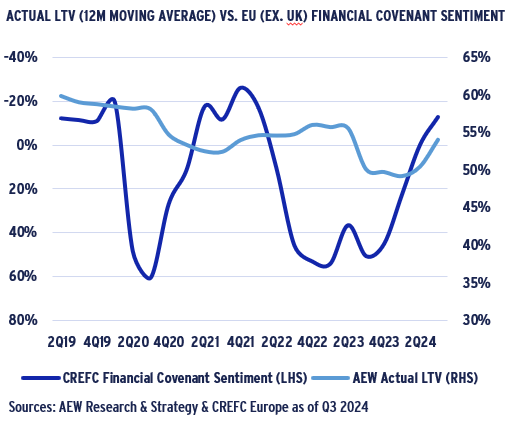
- CREFC Europe’s sentiment survey allows a further analysis of our in-house loan-by-loan data for Europe excluding the UK.
- The high degree of historical correlation between the change in the CREFC financial covenant sentiment and actual loan LTVs is worth noting.
- High values of the covenant sentiment indicate that lenders are more restrictive in terms of financial covenants when providing debt to the borrowers.
- The persistent increase in the survey results in 2022-23 indicate that lenders were requiring tight financial covenants and led to lower actual loan LTVs as shown in the chart.
- As the covenant sentiment survey results were decreasing steadily in 2024, actual average LTV levels increased in Q3 2024 reflecting a 1-2 quarter delay.
LOAN ORIGINATION VINTAGE SPECIFIC METHODOLOGY UPDATE
NEW DATA FACILITATES MORE REFINED DEBT FUNDING GAP ESTIMATE
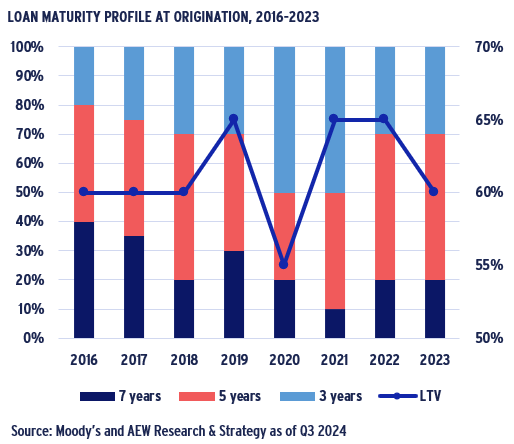
- To update our estimate of the debt funding gap, three assumptions have been refined based on new data not previously available: (1) loan maturity; (2) loan-to-value (LTV) ratio at origination; and (3) loan maturity extensions.
- In the past, we assumed a uniform 5-year loan maturity. However, our internal loan database shows that when interest rates are higher, loan maturities for new loans tend to be shorter.
- 2020-21 figures show that the average loan maturity dropped to 4.6 and 4.4 years, respectively, down from 5.3 years in 2016.
- External data was also considered to assume loans are split for each origination vintage into three maturity groups: short (3-years), medium (5-years) and long (7-years) maturities.
- Secondly, our past uniform 60% origination LTV was updated based on new data from Moody’s which allows us to assume loan origination vintage-specific LTVs as shown in the chart.
- Thirdly, 50% of loans maturing in 2023 were previously assumed to be extended by 1 or 2 years.
- However, recent market feedback allowed us to assume 25% of all 2023-24 loan maturities to be extended by two years.
VINTAGE SPECIFIC LOAN MATURITIES SPREAD DFG OVER TIME
- Our new assumptions expand our debt funding gap (DFG) estimate. To explain our updated methodology we provide the example of 2022 French office acquisitions as follows:
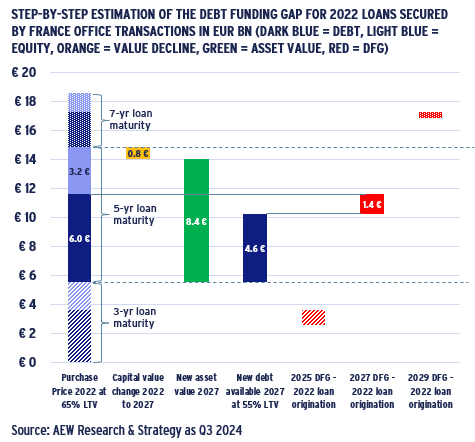
- Investors acquired EUR 18bn of French offices in 2022
- These deals were financed using different loan terms, 30% of loans are assumed at 3-years, 50% at 5-years and the 20% for 7-years as shown in the left stacked bar.
- 65% LTV is assumed across all three loan maturities.
- The chart focuses next on the 5-year (EUR 6bn) loans and its projected -9% value decline (EUR 0.8bn) at maturity in 2027.
- New debt volume is estimated at EUR 4.6bn or 55% LTV of the EUR 8.4bn new collateral value and DFG for 5-year loans is estimated at EUR1.4bn (EUR 6.0 bn– EUR 4.6bn) in 2027 in red
- DFGs of EUR 1.1bn in 2025 for 3-year loans and EUR 0.4bn 2029 for 7-year loans are calculated similarly and shown in shaded red.
- The cumulative DFG for 2022 French office financings is therefore EUR 2.9bn and spread over 2025, 2027 and 2029.
DEBT-ON-DEBT MIGHT IN PART HELP BRIDGE THE DEBT FUNDING GAP
- In past reports, we have highlighted the need for equity investors to inject additional equity to bridge the debt funding gap.
- Since many funds are facing redemptions and lack of new capital, equity investors have been mostly unable to fund shortfalls.
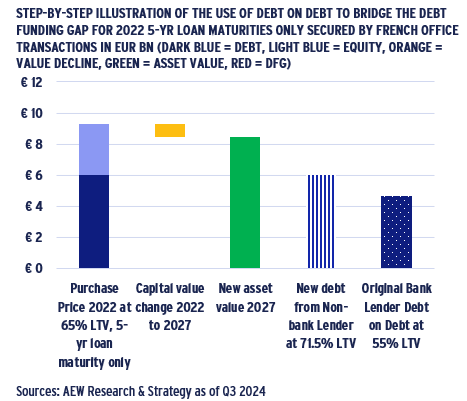
- However, debt-on-debt offers another solution. It allows for a new (typically non-bank) lender to offer a refinancing at the new higher LTV without any new equity capital, as shown in the chart.
- In return for refinancing a high LTV legacy loan, a US bank or opportunity fund could in turn finance a new non-bank lender with a loan at 55% LTV, without any direct security on the collateral.
- This new debt-on-debt has advantages for all parties involved: Original lender reduces high risk mortgage exposure with a low risk, unsecured loan with lower capital reserve requirements.
- New non-bank lender reduces its capital funding and implied risk to 55-71% LTV and receives accretive, low-cost debt financing.
- Equity investor avoids committing new capital as well as a painful loan default, assuming income can cover the higher interest rate.
ESTIMATED DEBT FUNDING GAP & CRE LOAN LOSSES MODERATE
€86BN EUROPEAN DFG FOR 2025-27
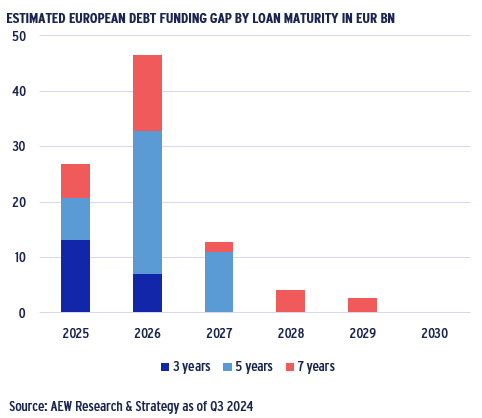
- Based on our updated methodology, we estimate a €86bn debt funding gap (DFG) for the next three years (2025-27). This is a reduction from the €99bn DFG we estimated in Apr-23 for 2024-26.
- The reduction is driven largely by pushing the period out by one year, especially as 2024 is nearly done and has a large DFG.
- Based on input from market experts, it was assumed that 25% of loans maturing in both 2023 and 2024 would be extended by two years. This has pushed the 2025 and 2026 DFG up.
- These extensions allow for the benefit of projected capital value improvements as accounted for in our DFG estimate.
- Across the 2025-27 period, 5-year loan maturities constitute more than half of the DFG in the next three years at €44bn.
- Furthermore, 3-year and 7-year loan maturities constitute €20bn and €22bn, respectively.
- After 2027, our DFG consists exclusively of 7-year loans originated in 2021-23. This could increase on account of shorter-term loans originating after 2023, if capital values recover less than projected.
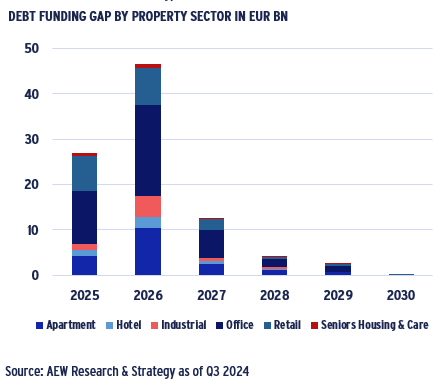
€86BN EUROPEAN DEBT FUNDING GAP – LED BY OFFICES & RETAIL
- Office-backed loans account for 44% of our €86bn DFG across 20 countries, followed by retail loans at 21%, residential at 20% and others at 15% of the total 2024-26 DFG.
- Since we use the new loan maturity assumptions, our estimated DFG extends further into 2030, when the 7-year loans originated in 2023 mature.
- The absolute volumes of the DFG are largely reflective of historical acquisitions and loan origination volumes in each of the sectors as well as the historical reductions and projected capital values.
- If we rank the sectors by the DFG as a share of their sector specific loan origination volumes, retail comes first with 19%, followed by offices at 16%, and residential at 12% and other sectors at 9% of their respective loan volumes.
- These results are in line with our previous DFG sector rankings.
13% RELATIVE DFG DOWN FROM 17%, BUT GERMANY REMAINS TOP
- The absolute value of DFG can also be expressed as a % of the regional loan volumes that would allow to not only identify sector but also countries with the most severe refinancing problems.
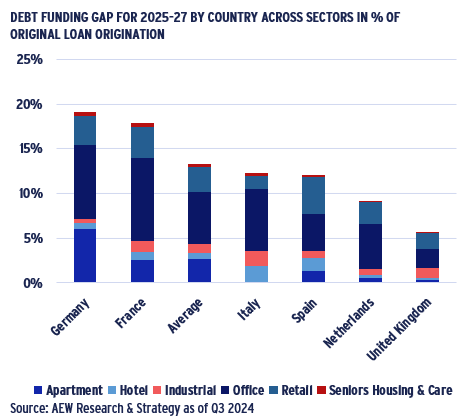
- Based on our new more refined DFG methodology, the relative DFG across Europe has come down to 13% for the next three years (2025-27) from 17% for 2024-26 in April.
- Germany continues to rank top with a €31bn DFG representing 19% of all 2016-23 loan originations. This is the highest share of loans affected across all 20 countries covered.
- France’s DFG is estimated at €17bn which constitutes 18% of original loans.
- Italian and Spanish figures are just below the average, at 12%.
- As before, the UK is on the lower end with DFG of just €10bn, or 6% of original loan volumes.
- Across all countries offices constitute the largest share of the DFG due to the volume of office transactions.
- The German residential-linked DFG is larger than elsewhere in Europe, due the sector’s large share in German deal volumes.
CRE LOAN LOSS ESTIMATE BELOW ACTUAL CMBS GFC LOSSES
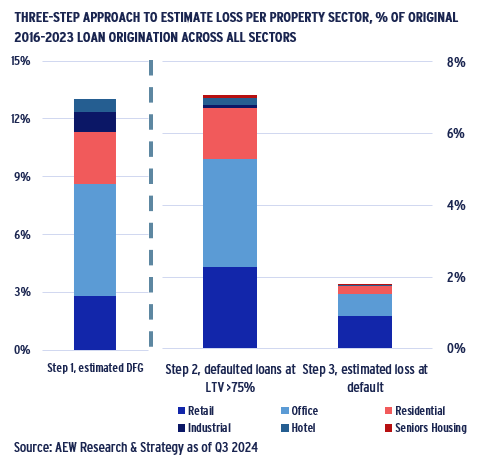
- Our DFG does not directly translate into expected losses for CRE lenders. However, we do estimate losses across all 20 countries’ six property sectors, and eight loan vintages in three steps:
- We start with the estimated DFG of 13% of original 2016-23 loan originations as explained above.
- Loans in a specific vintage segment are assumed to not refinance if the LTV at refi is above 75%. In that case the loan defaults, and the lender would repossess and sell the collateral to recover its principal. We disregard any unpaid interest.
- At default, we assume enforcement-related cost of 25% of the estimated collateral value at resale, leaving 75% to be recovered by the lender to cover its position.
- Based on this, 7.1% of CRE loans are estimated to default on maturity and losses for the 2016-23 vintages come at 1.8%.
- This implies an estimated loss on 2016-23 loans of €12.5bn.
- Our estimated loan losses are concentrated in the office and retail sectors, which suffered the largest repricing since 2016.
- Our latest 1.8% loss estimate is below both 2.3% historical actual European CMBS losses and our previous estimate of 2.5%.
ESTIMATED LOSSES ON RETAIL MORE THAN 3 TIMES OVERALL AVERAGE
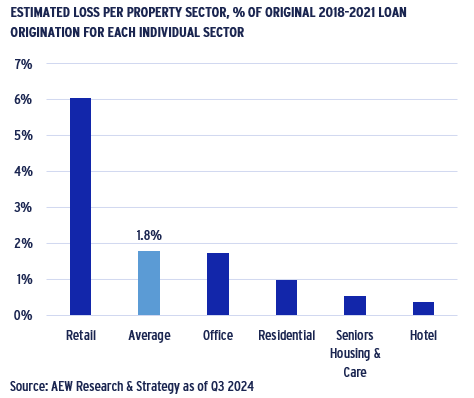
- Breaking out our loss results per sector and country allows us to highlight the most interesting differences.
- Losses estimated for retail-backed loans in the 2016-23 loan vintages stand at 6% of all retail loans originated - more than three times the overall average across all sectors.
- Please note that the denominator for this graph is each sector’s loan origination – not the all-sector cumulative loan originations.
- This high loss for retail loans is triggered by more significant and earlier collateral value declines since 2018. This is further emphasized by a more modest projected value recovery.
- Office-backed loan losses are projected at 1.7%, just below the overall average. Even if offices had significant value declines, they occurred later in the cycle and a recovery is projected from 2024.
- All other sectors show estimated losses below 1.0%, which is very modest. Low level losses in these sectors are easily reserved against by banks in case covenant defaults trigger cash traps.
PROJECTED LOSSES ON GERMAN COLLATERAL REMAIN TOP
- Looking at the geographic breakdown, estimated losses for German collateral-backed loans in the 2016-23 loan vintages stand at 3.1% - notably higher than the overall 1.8% average.
- Again, it should be noted that the denominator for this graph is each country’s loan origination – not the loan originations across all 20 countries covered.
- The German estimated loss is triggered by more significant capital value declines in 2022-23 with a less robust projected recovery in subsequent years when compared to other countries.
- France and the Nordics losses are projected slightly above the overall average at 2.0% and 1.9%, respectively.
- All other European countries and sub-regions, each show cumulative losses below 1.5%, below the overall regional average.
- These estimates are below the historical losses seen in post-GFC European CMBS loans. Regulators might have used these losses as a basis for setting lenders’ capital reserve requirements.
EUROPEAN BANKS CRE EXPOSURES, RESERVES & NPLs
FRENCH & SPANISH BANKS REPORT LESS HIGH LTV LOAN EXPOSURE
- To assess the impact of CRE loan loss estimates on lenders, we look at the EBA’s December 2023 LTV ratios of European bank loans.
- In the EU 27 overall, <60% LTV loans make up 63% of the book, while 11% of loans are in the +100% LTV loans.
- To state the obvious, high LTV loans are more likely to be hard to refinance, suffer defaults and cause losses to the lender.
- Finnish, French, and Spanish banks are least exposed to high LTV CRE loans as shown in the chart.
- Irish, Portuguese, and Dutch banks have larger exposures to high LTV loans – with Dutch banks being most exposed to +100% LTV levels with 17% of CRE loans in this case.
- Reported LTVs might not be entirely consistent as they might not be updated as frequently in each country
- Given recent market value declines, if lenders have not required collateral valuation updates, reported LTVs are unlikely to reflect the actual mark-to-market LTVs.
DURING 2023 CRE NPL COVERAGE RATIOS UNEXPECTEDLY WENT DOWN
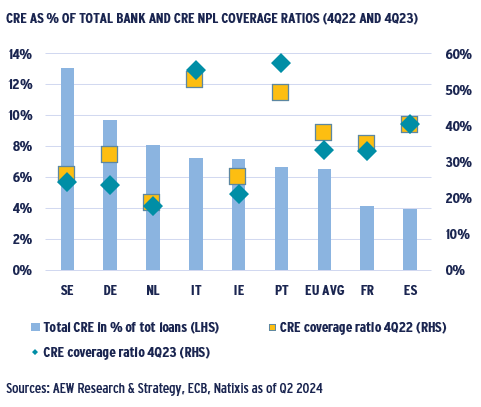
- CRE exposure remains a small part of EU banks’ overall lending at 7%. Sweden and Germany at 13% and 10% CRE loan shares are on the high end, while Spain and France are only 4%.
- CRE NPL coverage ratios show the degree banks have reserved against CRE loan losses.
- Given the recent value declines, it would be reasonable to expect European banks to increase their NPL coverage ratios.
- However, during 2023 the opposite happened as average EU CRE coverage ratios actually went down between Q4 2022 and Q4 2023, decreasing from 38% to 33%.
- This decrease is likely driven by German banks as their coverage ratio came down from 32% in Q4 2022 to 24% in Q4 2023.
- In turn, the relatively larger exposure of German banks to US CRE loans might have pushed their NPLs up in 2023 while not (yet) being able to step up their reserves.
- Given our forecasted recovery of European capital values, it seems that a further increase in NPLs and a decline in banks’ coverage in 2024 and beyond is unlikely. However close monitoring is required.
NPL RATIO OF CRE LOANS EDGING UP IN 2023 FROM A LOW LEVEL
- Despite the worrying increase of CRE loans as share of NPL’s, the NPL ratio of CRE loans of European banks has been trending downwards, decreasing from over 8% in 2020 to 4% in early 2023 as a result of write-downs and the sales of GFC legacy NPL loans.
- However, the NPL ratio started to increase from Q2 2023 to 4.5% in Q4 2023 due to the falling collateral valuations after the rise in interest rates. This can be partly explained by the increase in the NPL ratios of loans secured by US CRE.
- This CRE increase is in contrast with the NPL ratio of all bank loans (all sectors, including CRE) which remained stable during the same period, although early arrears have increased for consumer loans.
- At 4.5%, the NPL ratio of CRE loans is also nearly double the NPL ratio for all EU bank loans average of 2.3%.
- As European real estate collateral valuations continue to adjust to the market changes, a further increase in the NPL ratio of CRE loans might be expected going forward.
This material is intended for information purposes only and does not constitute investment advice or a recommendation. The information and opinions contained in the material have been compiled or arrived at based upon information obtained from sources believed to be reliable, but we do not guarantee its accuracy, completeness or fairness. Opinions expressed reflect prevailing market conditions and are subject to change. Neither this material, nor any of its contents, may be used for any purpose without the consent and knowledge of AEW. There is no assurance that any prediction, projection or forecast will be realized.

