PRIME TIME FOR CBD EUROPEAN OFFICES WHILE NON-CBD OFFICES TRAIL
- In this publication, we cover for the first time the European office markets beyond the usual prime segment of the market, to fully capture the polarisation between prime and secondary buildings which has accelerated with the increase in remote working.
- The definition for prime offices refers both to the location of the asset (central, accessible) as well as to the building’s specifications (quality, services, ESG etc). This report focuses on location characteristics due to current data limitations on building-level data.
- European office markets continue to adapt to the new normal of remote working. Office usage rates and planned office footprint reduction point to a lasting impact on occupier demand. Continued growth in office-based employment and a recent stabilisation of office space per employee partially offset these impacts.
- The fundamentals of occupier demand and supply show a fairly balanced picture going forward in Europe. Stock growth, which was already contained since the GFC, is expected to be further scaled back to under 1% p.a. after a moderate catch-up post-Covid. Simultaneously, net absorption is expected to revert back to higher, pre-pandemic levels from 2025.
- Combined with an increasing number of office conversions, supply and demand in European office markets are expected to rebalance. The vacancy rate is therefore expected to peak at 9% in 2024 and to decrease by 200 bps over the next five years as new development deliveries start to slow down. A peak in the European office stock can therefore be expected in the coming years.
- The more than twice higher vacancy rate of non-CBD office sub-markets (10%) compared to CBD locations (4%) illustrates the current level of market bifurcation. Occupiers are now favouring more central locations to convince workers to return to the office and can afford to do as they reduce their office footprint. Sought-after CBDs are therefore facing a lack of available supply, which is driving prime rental growth.
- By contrast, average contracted rents have remained stable, and incentives granted to tenants at the signature of a lease in non-CBD locations have increased. On a net effective basis, secondary rents have therefore been falling more than prime rents.
- Combined with an overall high level of capex in the office sector, means that net operating income for office investors often disappoints. In addition, energy efficiency is no longer a nice-to-have feature but a must-do reporting based on real energy consumption data to meet the requirements of both regulators, (potential) tenants and future buyers. This is expected to further exacerbate the current divide between prime and secondary assets and further increase associated capex.
- The European office investment market remains subdued with activity focused on small lot sizes and central locations with 2023 volumes close to a record low. This was triggered by investor’s concerns about the impact of remote working and their decision to diversify their portfolio away from offices.
- The record high yield spread between CBD and non-CBD submarket yields of 140 bps, also confirms the current bifurcation. Centrally located, prime assets, remain sought-after by many investors. Refinancing challenges - as quantified in our relative debt funding gap - remain significant for European offices and are expected to be concentrated in the non-prime part of the market.
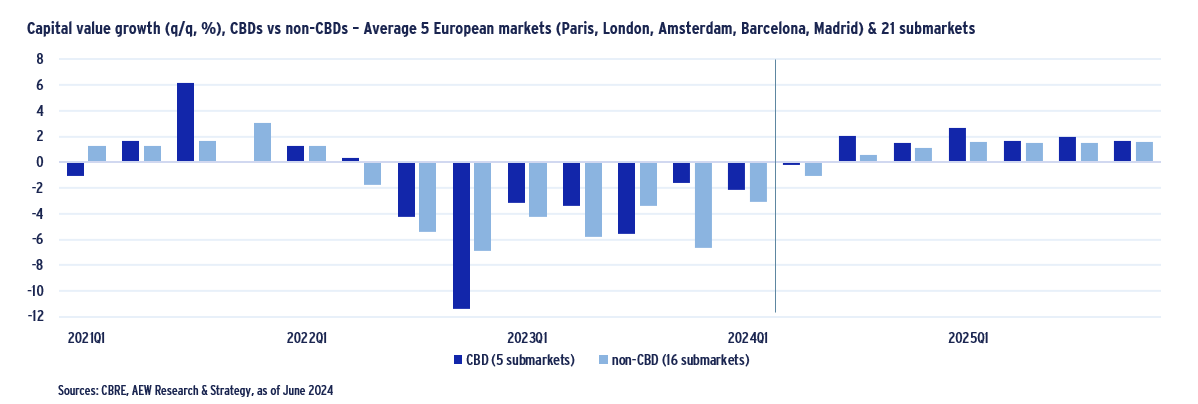
- Looking forward, prime office values are expected to recover faster than secondary offices, from H2 2024 onwards, after a significant repricing of more than 32% for CBD offices and 38% for non-CBD offices since mid-2022. This offers an attractive entry point for new investments in prime European offices. In fact, prime office returns are forecast at 9.6% p.a. driven by a combination of an expected average yield compression of 60 bps and solid prime rental growth. This is highest among all property sectors.
OFFICE DEMAND REMAINS NEGATIVELY IMPACTED BY REMOTE WORKING
OFFICE-BASED EMPLOYMENT REMAINS KEY DRIVER
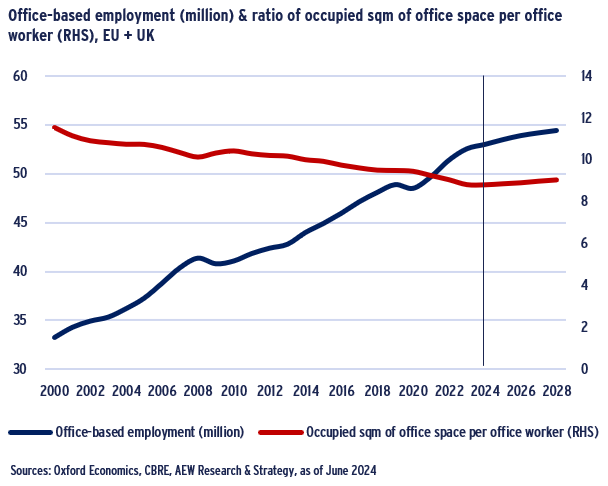
- Office-based employment in Europe (including the UK) has been rising steadily since the 2000s, only interrupted by the Global Financial Crisis and by the Covid pandemic.
- Office employment growth is expected to slow down to an average of 0.7% per year over the next five years, compared to 1.8% over the last five years, but should remain positive. This can be a key driver of demand for office space.
- The ratio of occupied sqm of office space per office worker has been steadily declining since 2000, due to the development of open-plan offices, remote working and desk-sharing policies. The typical ratio of workstation per employee is now 0.7.
- The average number of sqm of office space per employee has fallen from 12 sqm in 2000 to 9 sqm in 2023, a 24% drop. A stabilisation at this level is expected in the coming years.
- A key challenge for occupier’s ability to downsize is managing their worker’s usage peaks between working days as well as whether they are able to implement further desk-sharing policies.
OCCUPIER’S OFFICE FOOTPRINTS TO DECREASE FURTHER
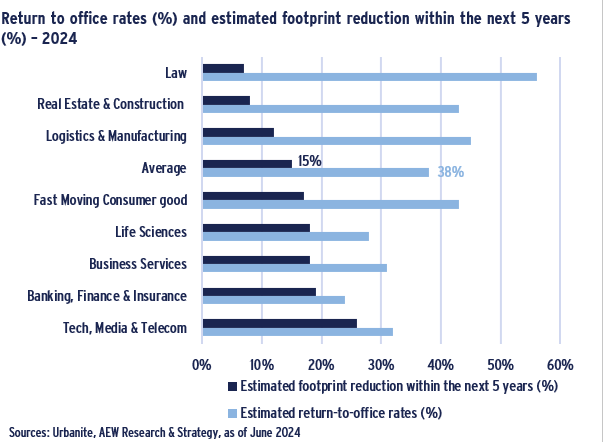
- According to the latest Urbanite survey of 105 international corporates, based in 25 different countries, covering around 45 million sqm of occupied space, return to office rate currently stands at 38%, well below the pre-pandemic levels of c. 60%.
- Legal businesses have the highest return to office rate at 56%, while surprisingly Banking, Finance and Insurance have the lowest rate at 24%.
- A further 15% reduction in space demand is projected over the next five years according to the respondents of the survey.
- This is lower than the 18% predicted in last year’s Urbanite survey, as many occupiers have already started consolidating their office footprint over the last year.
- Business sectors, such as financial services or tech show the lowest return to office rates and are also anticipating the highest planned space reduction.
REMOTE WORKING HERE TO STAY
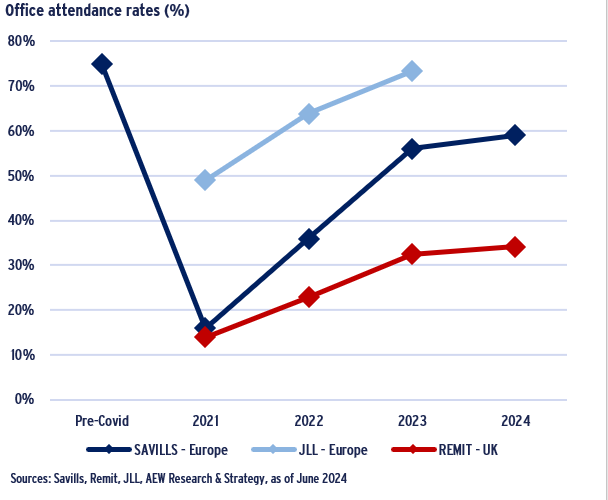
- Data on actual office usage is rather patchy in Europe but shows a stabilising trend of flexible working practices.
- Savills’s latest available data on average office occupancy shows that rates increased from 56% in 2023 to 59% in 2024, which still remains substantially lower than the 75% level recorded pre-Covid. JLL’s office usage ratio estimate is higher at 73% in 2023.
- Office usage data recorded by Remit Consulting in the UK stand out at much lower levels, reflecting the higher use of remote working in the UK than on the Continent.
- This is confirmed by other sources such as Urbanite. The average remote working allowance per week is indeed 3 days per week in the UK compared to 2.5 in Europe and North America.
- It should be noted that sources use various definitions and anchor points, but the overall trend is clear – remote working is here to stay.
OFFICE MARKETS EXPECTED TO REBALANCE WITH LIMITED NEW SUPPLY
EUROPEAN VACANCY TO DECREASE TO 6% BY 2028
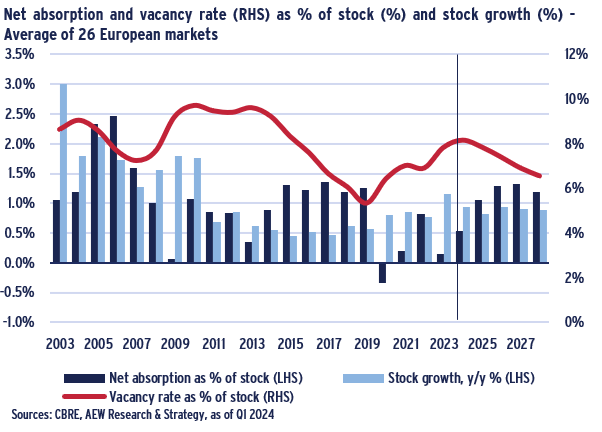
- Net absorption, or net take-up, measures the changes in the occupied stock. In our European 26-market average, net absorption is expected to rebound over the next five years, as many occupiers already implemented cost reduction measures.
- The average European vacancy rate currently stands at 8.0%, a sharp increase since the pre-Covid 4.7% level, but still well below the 10% high point of 2003-2004 and post-GFC level.
- The vacancy rate is expected to peak in 2024 as new development deliveries start to slow down. This is reflected in the weaker stock growth expected in the coming years (1.1% pa over 2024-2028), with net absorption ahead of new additions to office stock from 2025 onwards.
- This projected rebalancing of supply and demand means that the average vacancy rate across the 26 European office markets covered is expected to come down to around 6% by 2028.
GROWTH IN EUROPEAN OFFICE SUPPLY LOW AT 0.9% P.A.
- Concerns regarding offices have focused on future demand as discussed, but it is important to consider new supply as well.
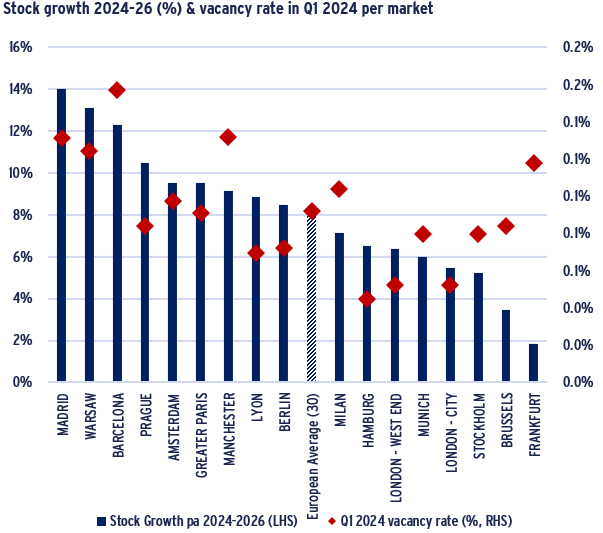
- CBRE projects office stock to grow 0.9% p.a. over the next two years across the 26 markets for which data is available. This is slightly lower than the historical average of 1.1% p.a. (2003-2023).
- Madrid, Barcelona & Warsaw with their high current vacancy rates will be vulnerable as they are projected to have a strong increase in stock as well.
- London and some German markets with low stock growth and below average current vacancy are better positioned.
- Beyond 2026, new supply is likely to decrease because:
1. Higher interest rates and lender’s risk-averse attitude towards offices limit the availability of new development debt finance and increase its costs
2. Lower anticipated sales prices and higher construction costs (materials and wages) have eroded developer’s profitability for planned projects.
3. Environmental regulations on life cycle carbon emissions are incentivising investors to retrofit existing buildings rather than developing new office buildings.
NON-CBD VACANCY MORE THAN DOUBLE CBD LEVELS
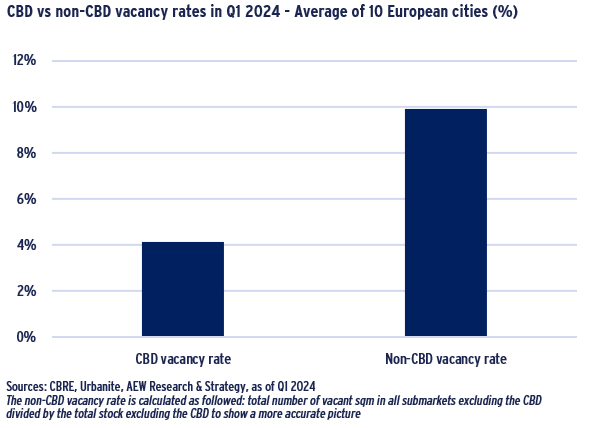
- The European office market is bifurcating between centrally located business districts where the demand dynamics remain strong and more peripheral office submarkets which have become less attractive post-pandemic.
- The current vacancy rate in CBD locations stands at 4.2% (average of 10 European office markets), compared to just below 10% for non-CBD submarkets.
- Central locations with excellent public transport accessibility are indeed deemed key to attract and retain employees, especially when unemployment rates are low.
- Occupiers are now favouring more central locations and can afford to do as they reduce their office footprint. This also explains why prime office rental growth has been so strong post-pandemic.
- This trend is likely to continue. In the 2024 Urbanite survey, 9 out of 10 companies have moved or are planning to move to more central locations. This can help convince office workers to return to the office as well.
OFFICE CONVERSIONS AND RETROFITS CAN DEFINE THE NEXT CYCLE – NOT NEW SUPPLY
TOTAL OFFICE STOCK LIKELY TO HAVE REACHED A PEAK
- The total European stock of office space currently stands at around 370 million sqm. Across the largest office markets (39 markets in total) this implies a 5% growth, or 18 million sqm since 2015.
- As a result of increasing concerns about future office demand, investors and lenders are less likely to finance the development of speculative or only partially pre-let office buildings. This means that the total office stock in Europe will likely reach a peak in the coming years.
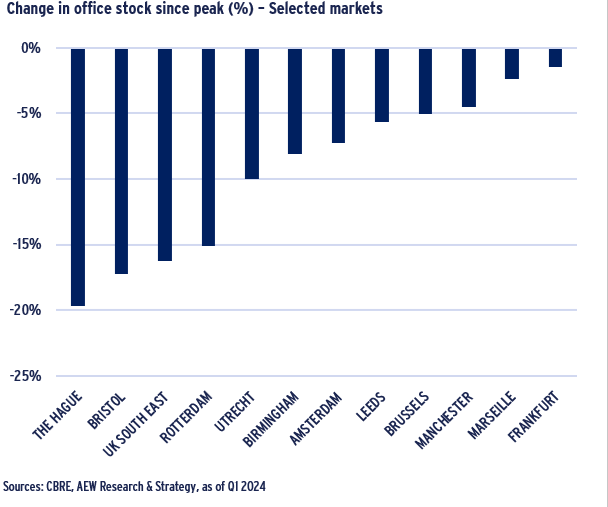
- While new office developments continue to add space to the market, conversion of office buildings have also taken space out, in particular in the Dutch and UK regional office markets where office stock has been cut by more than 15% since a peak in 2013-14.
- In total, 20 million sqm of office space has been converted into other uses since 2014 in Europe. This trend is likely to accelerate going forward as more offices become obsolete.
- With the current focus on lifecycle carbon emissions, retrofitting existing buildings is increasingly encouraged by regulators as opposed to demolition/reconstruction – which adds financial, technical and building quality challenges.
OFFICE CONVERSION PROFITABILITY INCREASES
- Office conversions into other uses, in particular residential, is seen as a solution to offer a second life to vacant, obsolete office buildings, as well as to address the long-standing shortage of housing.
- Office conversions have proved limited so far due to technical challenges (deep floorplates limiting natural light, fire and safety regulation, building size, etc), unsupportive planning authorities and high costs leaving many potential projects unprofitable.
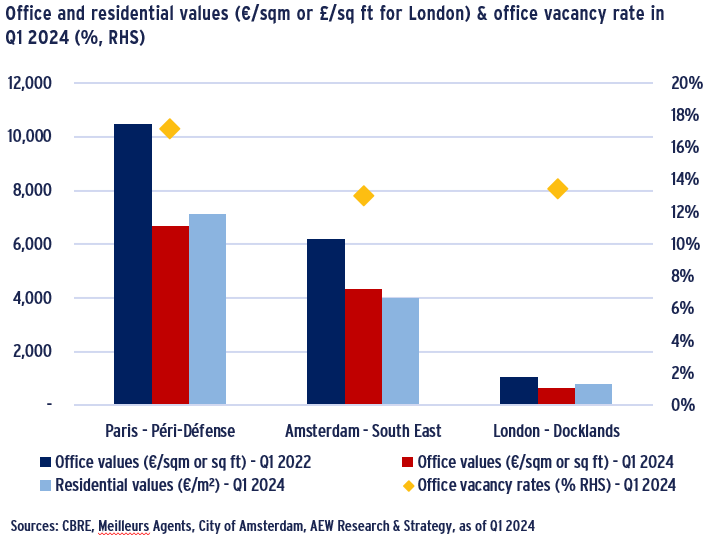
- The higher office value per sqm - compared to residential values per sqm - has also been raised as an issue in the past. But with the significant repricing of offices since the rise in interest rates, this is less the case today. This is particularly the case in peripheral submarkets where office vacancy is high such as Paris – Péri-Défense, Amsterdam – South East and London – Docklands.
- This, combined with more practical planning regulation to facilitate the change of use, explains why the number of office conversion projects has been increasing across Europe despite the less supportive financing environment.
ENERGY-EFFICIENCY ANOTHER KEY POLARISING FACTOR
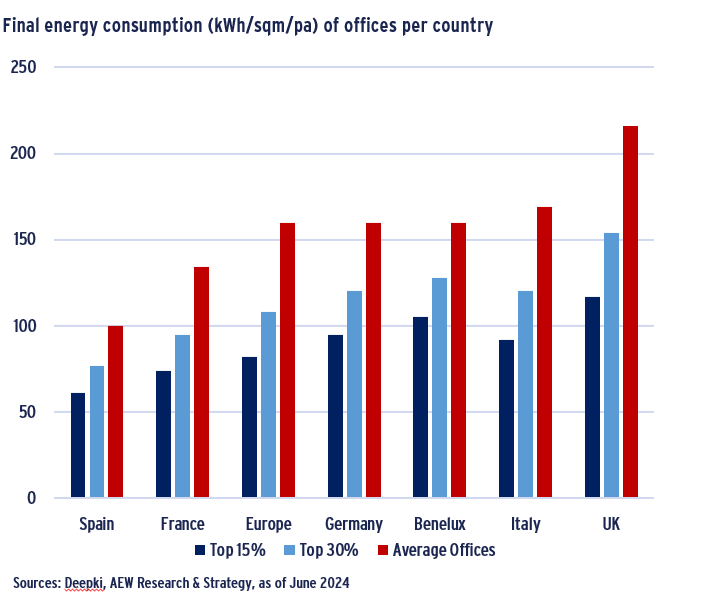
- Energy intensity is becoming another key factor differentiating prime to secondary assets. Deepki data, based on actual energy use at the source of production, allows comparison between the top 15% and top 30% with the average office energy intensity per sqm.
- The most efficient top 15% of office buildings have an actual energy consumption of 82 kWh/sqm/pa, half the average energy consumption of the entire office buildings sample (160 kWh/sqm/pa).
- Differences between markets are also significant, with energy intensity generally higher in UK offices.
- To get an accurate picture of the energy efficiency of office buildings, it would be ideal to look at energy intensity per capita, in order to take office density into account, but data on headcount is not easy to track. This could partly explain why UK office buildings, which tend to have a higher density than on the Continent, have a higher energy consumption per sqm.
- French regulation (“décret tertiaire”) allows to adjust energy intensity targets based on office occupation, number of sqm per workstation and use intensity (opening hours).
BEYOND PRIME: LIMITED RENTAL GROWTH & HIGH INCENTIVES IN A CAPEX-HEAVY SECTOR
AVERAGE RENTS STALL WHILE PRIME MOVES AHEAD
- Most office rent data collected are for prime quality office space.
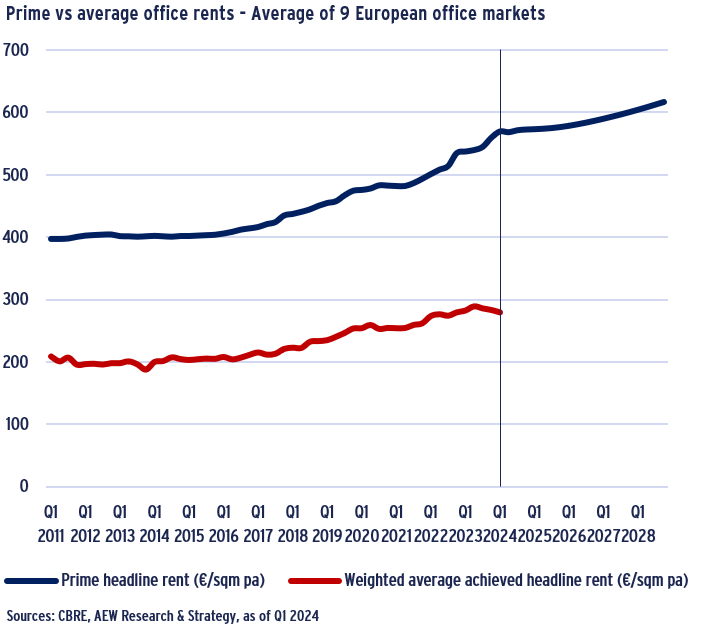
- CBRE also tracks weighted average achieved rents for nine European markets across Europe (Paris, Berlin, Frankfurt, Munich, Hamburg, Düsseldorf, Milan, Brussels and Warsaw). Average rents reflect the wider office occupier market better.
- While prime office rents for these same nine markets have increased by 2.8% p.a. since 2011, average contracted rents have increased by 2.3% p.a. during the same period.
- More recently, the bifurcation has increased as average rents decreased by 1% y/y in Q1 2024, while prime office rents increased by 6%.
- Many occupiers have been securing higher-quality office space in the best locations at a high cost. This should support prime rental growth going forward in the most sought-after and undersupplied office submarkets.
- Markets expected to outperform in terms of projected prime rental growth over the next five years are London – City (4.9% pa), London – Southbank (4.3% pa) and London - West End, Amsterdam and Barcelona (3.5% pa each).
OFFICES TO BECOME MORE CAPEX-HEAVY
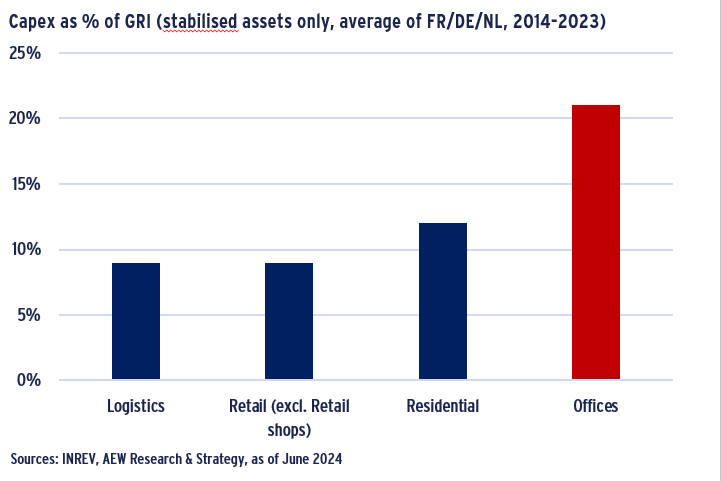
- Another significant but often overlooked factor is the higher ratio of capex as a percentage of gross rental income (GRI) for offices compared to other property types.
- According to data from the INREV Asset Level Index, capex in the portfolio of institutional investors are the highest in percentage of GRI for offices at 21%.
- These are calculated for stabilised assets only, excluding developments and refurbishments.
- These estimates are based on data on invested capex since the start of the Asset Level Index in 2014, until 2023. However, capex are likely to increase further as a result of a faster rate of obsolescence for offices and stricter environmental and energy efficiency regulations.
INCENTIVES REFLECT THE INCREASING POLARISATION
- To more fully grasp the extent of the bifurcation in the office market, is it fundamental to also look at incentives.
- These are defined as rent-free periods, step-up rents and other incentives agreed by the landlord to secure a lease with a tenant. These incentives are calculated as a percentage over the total headline rent to be paid during the full length of the lease.
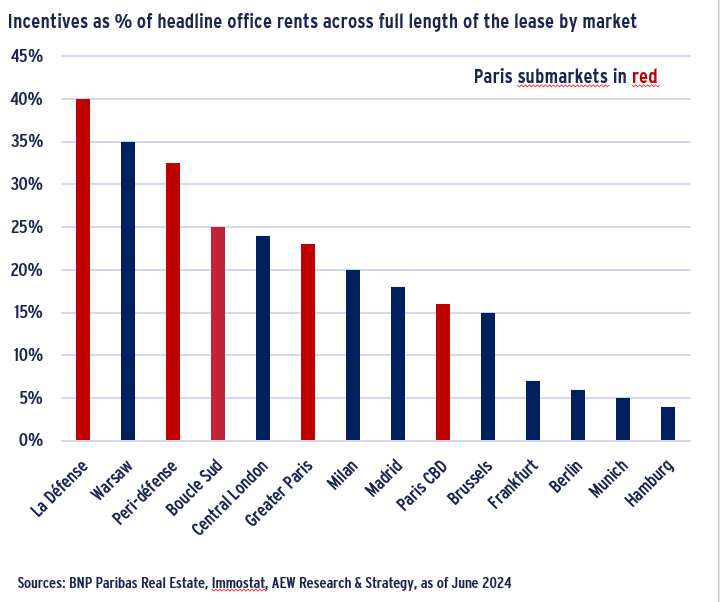
- There is limited transparency on incentive levels. According to BNP Paribas Real Estate, incentives are typically low in the German markets (between 4% in Hamburg and 7% in Frankfurt), and higher in Paris (23%), London (24%) and Warsaw (35%).
- Within larger markets, incentive levels vary significantly by sub-market. Using the example of Paris, incentives currently range from 16% of headline rents in Paris CBD, to a record high of 40% in La Défense.
- Net effective rents are therefore significantly lower than headline rents in some sub-markets, even if data limitations don’t allow us to take these into account across our entire European office market coverage.
A SHRINKING INVESTMENT MARKET AS INVESTORS DIVERSIFY AWAY FROM OFFICES
OFFICE TRANSACTIONS PLUMMETED
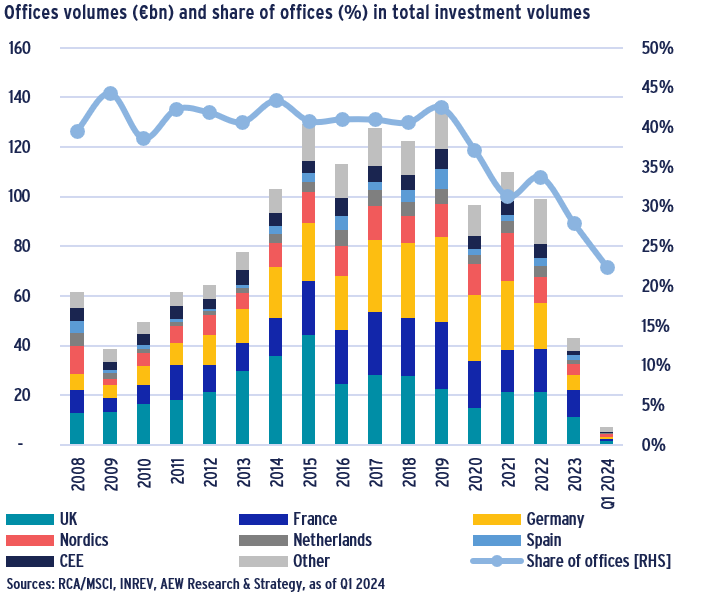
- European office volumes totaled €43bn in 2023, a 56% decrease compared to 2022 and a 60% decrease compared to 2021. This is also very close to the post-GFC historic low of 2009 (€39bn).
- While a similar decline can be seen in many other sectors of the market, the office sector has been the most impacted as investors are increasingly concerned about the sector’s fundamentals and their exposure to it.
- Indeed, according to the INREV 2024 Investment Intentions Survey, only 52% of the respondents are planning to invest in offices, down from 84% in 2021.
- The office sector has therefore seen its investment volumes share decrease from 43% pre-Covid to 22% in Q1 2024.
- The French market, where offices traditionally represent 60% of the invested volumes, has been particularly impacted.
- Most institutional investors are now seeking to reduce their exposure to the office sector. Many retail funds, which have traditionally been overallocated to offices, are also looking to diversify away from offices.
CBD INVESTMENTS MOST LIKELY TO BOUNCE BACK
- Office transactions remain scarce with investors and valuers continuing to struggle to gauge values and yields as transaction evidence is limited and bid/ask spreads remain high.
- Transactions are currently dominated by small lot sizes and very good locations. Current buyers include family offices/HNWIs and owner-occupiers entering the market at an attractive point in the cycle and focusing on long-term hold.
- There is still interest from institutional investors, but only for some of the best locations.
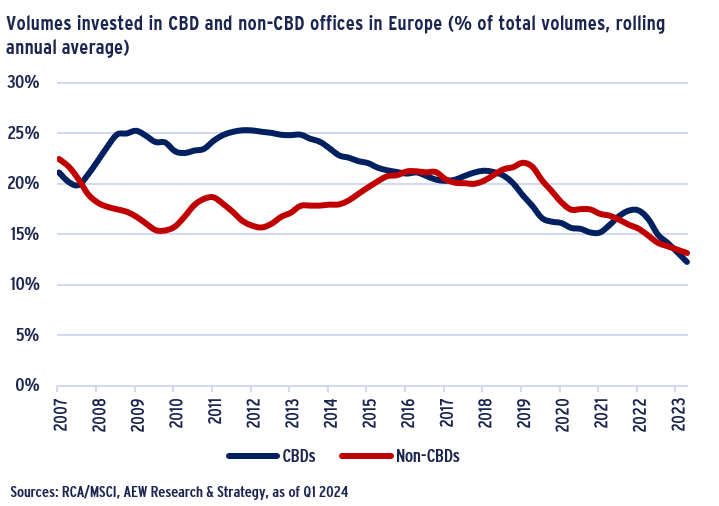
- Looking at volumes invested in CBD locations as opposed to non-CBD locations, as percentage of total volumes invested in real estate, the downward trend is very similar.
- Nevertheless, an increase in CBD office investments can be expected in the coming years as liquidity and investor’s appetite for future-proof assets, as well as office values, recover.
REFINANCING CHALLENGES REMAIN HIGH FOR OFFICES
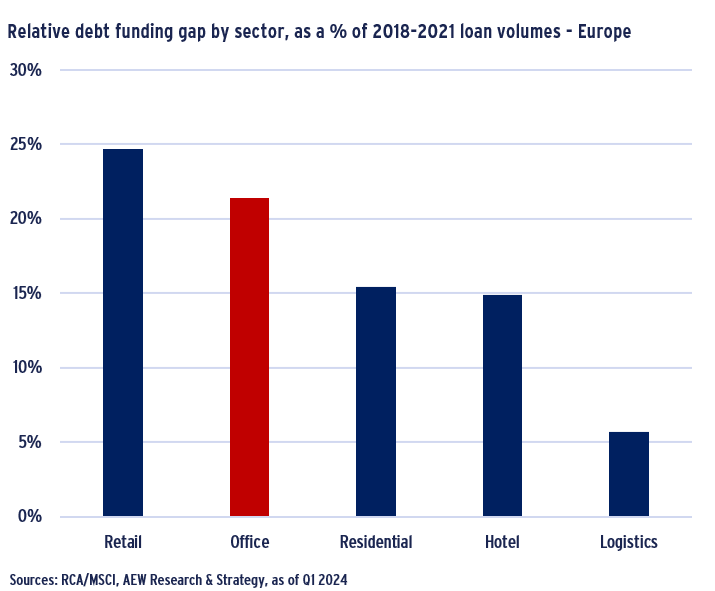
- Refinancing challenges remain a major headwind for investors. Our estimate of the debt funding gap (DFG) represents the potential shortfall between the originally secured acquisition debt and the amount available for refinance at the loan maturity.
- Our DFG estimate is primarily driven by lower collateral value projections as they drive up loan-to-values (LTVs) at refinancing and also the lower LTV levels available from lenders at refinancing.
- Our relative DFG estimate takes into account the differences in acquisition and debt origination volumes between property sectors and 2018-21 loan origination vintages.
- Comparing property sectors, office-backed loans show a high relative DFG with 21% of 2018-21 originated loan volumes expected to face refinancing issues, compared to 25% for retail, 15% for residential and only 6% for logistics.
- Our debt funding gap is expected to further push up the increasing bifurcation of the market as capital value declines are expected to be concentrated in secondary assets or locations.
INCREASING BIFURCATION IN THE OFFICE INVESTMENT MARKET
CBD OFFICES SET TO RECOVER FASTER THAN NON-CBD
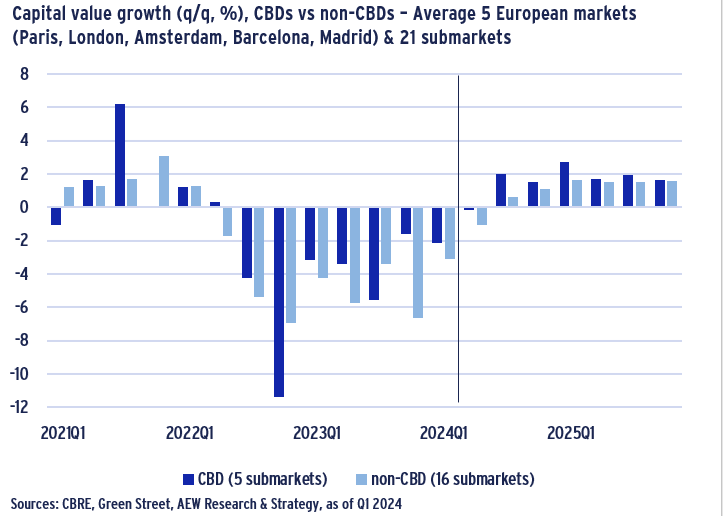
- Cumulative capital value decline for CBD offices in the current cycle is projected at -32%. For non-CBD offices sectors, the cumulative capital value decline is forecast at -38%.
- Our latest base case projections indicate a modest capital value recovery for offices, starting from H2 2024, driven by CBD offices. Cumulative capital value growth is expected to reach 12% for CBD offices and 8% for non-CBD offices from Q3 2024 until Q4 2025.
- Timing this expected recovery in office capital values is challenging as bid-ask spreads remain large in the office sector.
- Many potential sellers are still absorbing ongoing valuation declines and potential buyers might feel that it is too early for capital values to have bottomed, especially for non-CBD offices.
- Separately, Green Street office data confirms a -37% decline in line with our non-CBD market data. However, they are projecting a more subdued recovery until 2028.
CBD VS. NON-CBD YIELD SPREADS AT RECORD LEVEL
- Our recently updated prime office forecasts indicate a 60 bps yield compression by 2028 across our 62-market average, after prime office yields peak at 5.5% in 2024.
- Most markets are projected to have fully repriced with only limited yield expansion for some markets expected in H2 2024.
- Our prime office yield forecasts reflect the Oxford Economics forecasts of falling government bond yields as the ECB started decreasing its base rates on the 6th June 2024.
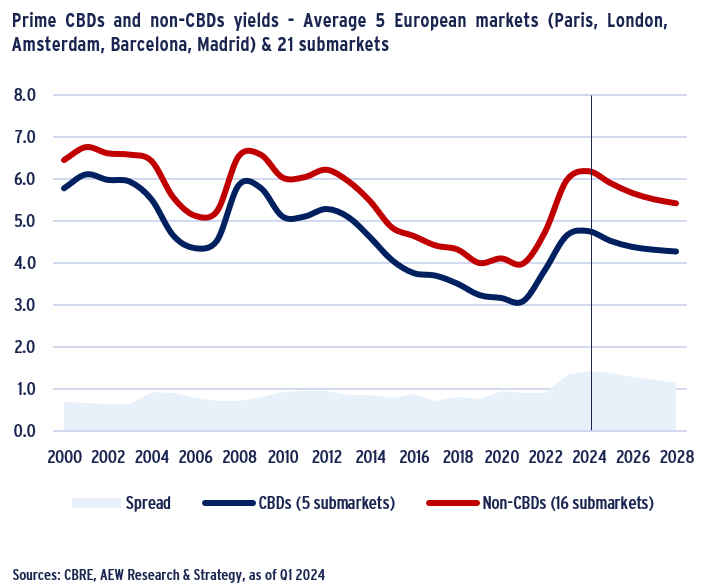
- Looking again at our selection of 5 European office cities, we note that the spread between CBD and non-CBD yields has never been greater than the current 140 bps.
- Across this more limited sample, prime CBD yields are expected to peak at 4.8% in 2024, before compressing by 50 bps over the next five years, while non-CBD yields are expected to peak at 6.2% also in 2024 before compressing by 80 bps. A return to the record low yield level of 2022 is therefore unlikely.
- This reducing spread between CBD and non-CBD locations could offer a temporary opportunity for investors in non-CBD markets, assuming their risk profile warrants it.
CBD TOTAL RETURNS NOT ALWAYS THE STRONGEST
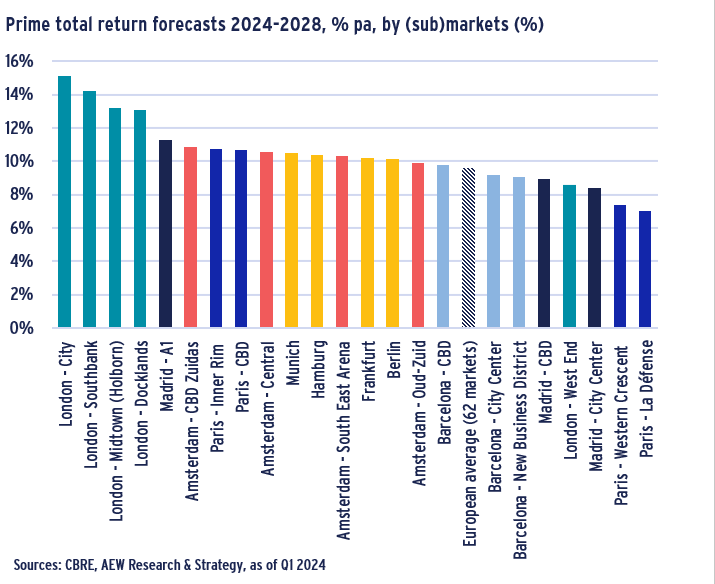
- Our recently updated prime office forecasts show that total returns are expected to reach 9.6% per annum over the next five years on average across our 62 covered European markets.
- This is due to their bigger than previously expected repricing in 2023, the 60 bps yield compression expected over the next five years, combined with solid rental growth of 2.2% per annum.
- With some London markets projected to reach 13-15% returns, across all office (sub)markets prime total returns are projected to exceed 6% per annum over the coming 5-year period.
- Our forecasts are for prime quality office buildings. Looking at the different submarkets, CBD markets are not always expected to outperform in terms of total returns given their lowest yields.
- London City, Southbank, Midtown and Docklands are expected to outperform, while in London’s West End total returns are penalised by low initial yields.
- By contrast, Paris CBD is expected to outperform other submarkets except the Inner Rim, while the Paris Western Crescent and La Défense are forecast to underperform.
This material is intended for information purposes only and does not constitute investment advice or a recommendation. The information and opinions contained in the material have been compiled or arrived at based upon information obtained from sources believed to be reliable, but we do not guarantee its accuracy, completeness or fairness. Opinions expressed reflect prevailing market conditions and are subject to change. Neither this material, nor any of its contents, may be used for any purpose without the consent and knowledge of AEW. There is no assurance that any prediction, projection or forecast will be realized.