PRIVATE INFRA LENDERS TARGET SOLID MARGINS AT MODEST RISK
- For the first time, we provide a brief introduction to the private infrastructure (infra) project financing markets in terms of historical issuance, returns and risks across geographies and subsectors. Infra is a multi-faceted asset class, providing essential services that are paramount to the continued functioning of modern economies, ranging from transportation to renewables and traditional energy and telecommunications.
- Historically, infrastructure projects were financed by public and semi-public entities as well as private banks. However, since the early 2010s infrastructure debt has become a more institutionalised asset class, driven by more constraining bank regulations (Basel III) and supportive regulation for insurance companies (Solvency II).
- As a result of pressures on fiscal policies, accentuated after the Covid pandemic, governments have incentivised the private sector to fill the infrastructure investment gap. A combination of monetary tightening, constrained bank lending and a higher interest rate environment has also provided private lenders with attractive loan margins.
- This shift in capital sources is also driven by the widening gap between future infra financing needs and recent levels of infra funding. The G20 estimates an average $75bn annual shortfall between 2023-27.
- Infrastructure debt usually accounts for around 80% of private infra investment (with adjustments according to the risk attached to each transaction). Despite the challenging macroeconomic conditions, we recorded 42% global annual growth in infra debt volumes in 2023.
- It is worth noting that on the contrary to bullet real estate debt financings, many infrastructure financings are structured with an embedded amortizing structure. Most infra refinancings therefore result from corporate events like M&A or due to the end of the construction period.
- Despite a strong historical performance, both global and European infra stock indices have been underperforming the overall global stock index, post-Covid. On the bond side, as inflation increased and fear of central policy rate hikes were priced in, performance on both infra and general corporate bond indices weakened.
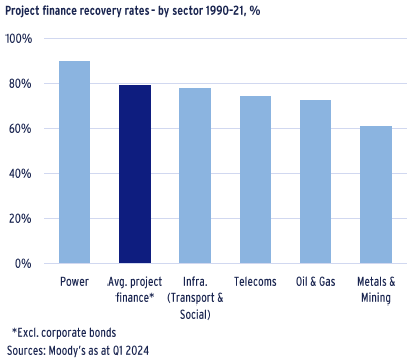
- Based on Moody’s data, the cross-sector project finance average cumulative default rate stands at 5%, just above the Baa corporate bond average, with metals and mining as well as telecoms more in line with the average Ba corporate bond average. Recovery rates vary significantly between 92% and 61% for power and metal & mining, respectively.
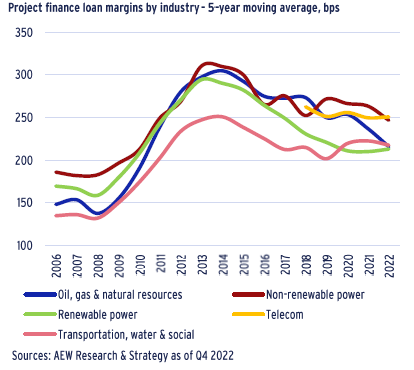
- Our in-house database shows that across infra subsectors, average loan margins range between 200-250bps. Transportation has the lowest loan margins over the 2002-22 period. Renewable margins have come down significantly recently, as increasingly lenders are keen to expand their exposure to the subsector once emerging subsectors such as offshore wind have also become more mature.
- Individual deal data shows an even wider range across individual deals of between 40-600bps. This confirms the idiosyncrasy of infra project financing pricing, where the specifics of each infra project plays a key role in the pricing of each loan.
INTRODUCTION TO INFRASTRUCTURE DEBT & INVESTMENT LANDSCAPE
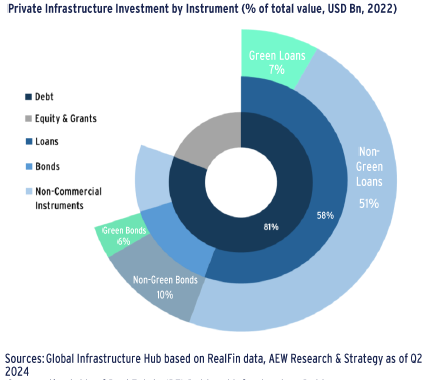
+80% OF PRIVATE INFRASTRUCTURE PROJECTS ARE DEBT FINANCED
- Over the last decade, the share of debt financing of private infrastructure projects ranged from 73% in 2012 to 81% in 2022.
- This range reflects the amount and types of transactions made during these years (low risk financing tends to have a higher debt component) and less a result of lower interest rates over this period.
- Across debt, the loan share has been impacted by post-GFC capacity problems with traditional banks needing to meet tougher Basel III capital reserve requirements.
- However, at nearly 60%, loan financings still dominated in 2022, despite a decline in the last few years.
- This reduction in loans' market share can also be attributed to the rise of bond issuance and other non-commercial instruments.
- The share of bonds increased to 15% as they offer investors easy diversification and potential secondary liquidity, while issuers access a wide investor pool and can match long maturities of their projects.
- Green bonds and loans at 6% and 7%, respectively, are becoming increasingly popular but are limited to high-income countries.
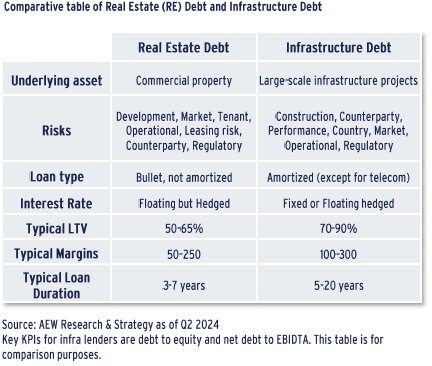
INFRASTRUCTURE & REAL ESTATE DEBT DIFFER IN SEVERAL WAYS
- Infrastructure debt pertains to the financing of public facilities in most cases rather than the typical ‘bricks and mortar’ assets seen in real estate.
- Given the public nature of these infrastructure projects, investors can benefit from reduced competition from other providers, otherwise present in real estate.
- Nonetheless, infrastructure project risks can be more unique and are synonymous to each subsector. For example, impact of lower disposable incomes and closed trade routes (transport) and new climate change policies (renewables), to name a few.
- Infrastructure loans are structured to meet the long-term nature of these projects, reflected in their higher loan-to-value ratios (LTVs).
- Despite higher LTVs on average, leverage from an income coverage perspective tends to be lower compared to real estate debt.
- Infra loans also typically have longer dated rate fixing and loan maturity which reduces the exposure to interest rate risk.
- Higher margins for infra loans might be tied to longer maturities, as well as a higher degree of idiosyncratic project related risk.
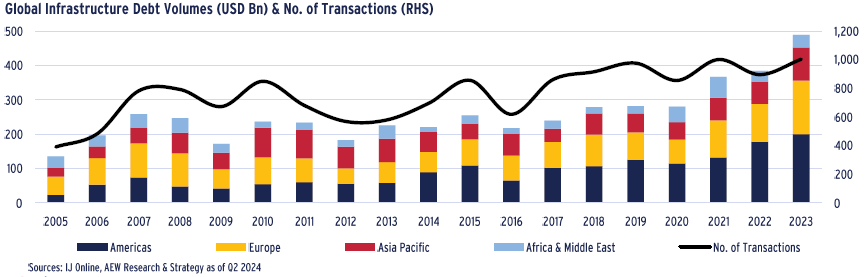
GLOBAL INFRASTRUCTURE DEBT VOLUMES SET NEW RECORD IN 2023
- Global infrastructure debt volumes reached a new record high of nearly $500bn in 2023, marking a 26% increase Y/Y. This was driven by annual growth across all four major regions in 2023.
- Over the past ten years, Europe (driven by renewables and telecoms) and Africa & Middle East (driven by natural resources) recorded the fastest growth in debt volumes, followed by Americas and APAC.
- Despite this faster growth, Americas accounted for 41% of 2023 total volumes, followed by Europe with 32%.
- Similarly, deal count peaked in 2023 to 1,004, just ahead of the number recorded in 2021.
- Overall, this positive trend is indicative of the growing requirements of infrastructure debt, supported by its defensive characteristics (e.g., inflation-linked income) during times of crises.
- The diversification among infrastructure assets that provide essential services to our societies, allows institutional investors to capitalize on the long-term and stable income streams offered by this asset class.
DEEP DIVE INTO INFRASTRUCTURE DEBT VOLUMES
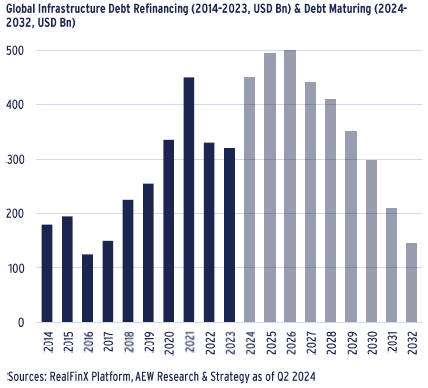
UPCOMING REFINANCINGS WILL TRIGGER HIGHER VOLUMES
- Global infrastructure debt refinancings vary per year depending on prevailing interest rates and upcoming loan maturities.
- Notably, in 2021 refinancing surged to approx. $450bn, as investors took advantage of the lower interest rates.
- Based on past loan originations and maturities, a sizeable proportion of global infrastructure debt is expected to mature between 2024-32, with nearly $500bn in debt due in both 2025 and 2026.
- However, most infra financings are structured with an embedded amortizing structure. This is a key difference with real estate and explains why there is no debt funding gap in infra.
- Refinancings of infra debt transactions often result from voluntary moves e.g., mergers and acquisitions and the end of construction periods, rather than factors like the end of the initial loan.
- Despite higher LTV, operational interest rate sensitivity in infra is lower due to lower debt to operating income, and generally longer maturity and rate fixing.
- In addition, tighter bank regulations, i.e. Basel III and supportive regulations for insurance companies (Solvency II), have made infra a more institutional asset class over the last 10 years.
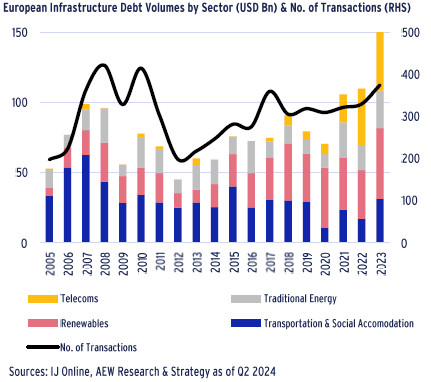
RENEWABLES & TELECOMS REPORT FASTEST GROWTH
- In 2023, all four major infrastructure sectors registered annual increases across Europe, resulting in a record high total of $156bn in infrastructure debt volumes.
- It should be noted that there is no universal classification of infra subsectors across the various sources at our disposal.
- Based on IJ’s definitions, renewables and telecoms showed the strongest growth, while transportation & social accommodation as well as traditional energy are trending downwards.
- Renewables have become the most popular sector, attracting 32% of total capital in 2023. Ambitious net-zero targets from governments and corporates alike have created this large opportunity.
- Telecom volumes have grown since Covid, accounting for 30% of total debt in 2023, as data storage and connectivity needs e.g. data centres increase, driven by cloud and artificial intelligence systems. However, this growth in telecoms credit volumes is not necessarily reflective of attractive credit quality.
- Transportation debt volumes slowly rebounded after subdued refi activity during the Covid pandemic.
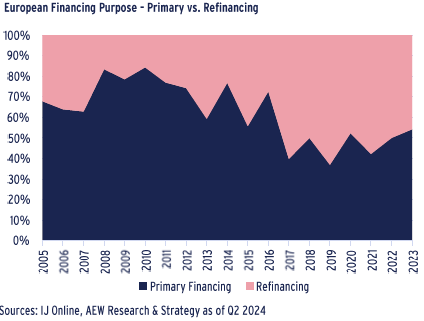
GROWING SHARE OF REFINANCINGS OFFERS STABLE PIPELINE
- Despite the fluctuating data, the overall trend indicates a rise in refinancing activity as a percentage of total European infrastructure debt volumes (same as chart above).
- The level of refinancings increased by 130% from 2005-23. At the same time, the amount of primary financing only grew by 29%.
- The rise in interest rates has encouraged investors to maintain their existing arrangements. As well as economic market conditions, this rise is also reflective of the long-term nature and longer loan lengths of this asset class.
- More recently, the level of primary financing has slowly been increasing since 2021. This remains crucial in addressing the infrastructure gap that still exists across many countries by initiating new projects.
DIFFERENT SUBSECTORS & MAJOR TRENDS
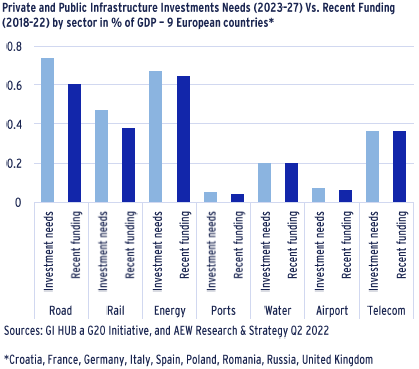
FUTURE NEEDS EXPECTED TO EXCEED RECENT FUNDING
- Future funding needs for the next five years across all infra subsectors are projected to be on average $75bn p.a. higher than the current investments.
- This amounts to 0.45% of GDP across 9 European countries according to the GI Hub latest estimation in 2022.
- Even traditional sectors such as energy and roads are still showing a gap for the next 5 years highlighting the needs for further investments in these mature sectors.
- The transportation sectors and specifically the road and rail sectors are showing the highest gaps in Europe in the next 5 years at respectively 0.15% and 0.10% of GDP. This implies a strong demand in investment and debt funding for road and rail projects.
- On the other hand, the mature sectors such as airports already have levels of investments that are in line with projected needs.
- Despite relatively low share in GDP, water infra projects are likely to become of strategic importance in southern Europe, especially in the context of rising temperature and climate risk.
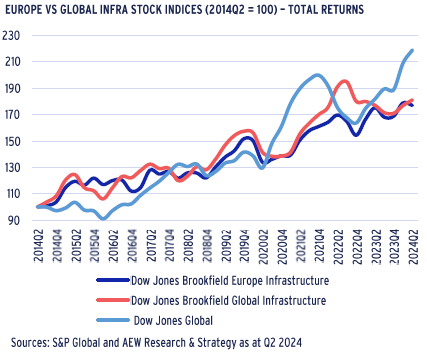
INFRA STOCKS TRAIL OVERALL STOCKS POST PANDEMIC
- Indices for publicly listed infrastructure stocks show an upward trend in the long term, despite higher volatility since Covid.
- Since 2014, global infra stocks have seen a slightly better returns level similar to European infra stocks.
- Both global and European infra stock indices have been underperforming the overall global stock index post Covid.
- Recently, the listed infrastructure stocks have been significantly impacted by Covid and the real interest rate increases.
- Higher inflation is generally an upside in infra, with often a direct inflation linkage on the revenue side.
- Given the lower perceived risk for infrastructure the scope for upward re-valuations is less than overall stocks. This explains why structural stock index returns are lower in the infra sector.
- Equity returns are unlikely to impact on providers of bond or project finance unless they reach a negative level for prolonged periods.
- Investors might be reluctant to go into infrastructure stock given this recent underperformance leaving the bond market to fulfil the funding needs of the sector.
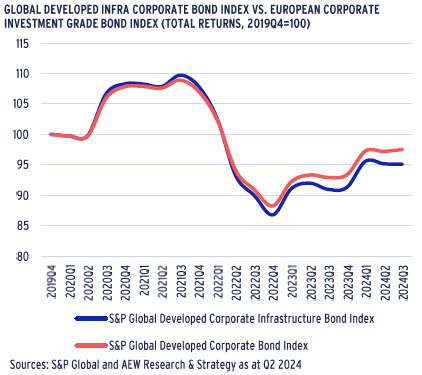
INFRA BONDS IN LINE WITH CORPORATE BONDS
- Given the recent start date of the S&P global infra corporate bond index, a long-term comparison of returns is not possible.
- Over the available period from 2019, global corporate infra bonds have performed in line with global corporate bonds as shown.
- In the immediate aftermath of the Covid lockdowns we see good performance of both corporate bonds indices as central banks continued their quantitative easing and bond buying programs.
- As inflation increased and fear of central policy rate hikes were priced in, performance of both indices weakened.
- Investors might be reluctant to invest into infrastructure bonds given their recent underperformance. The longer duration in infra vs. general corporate bonds sought by many investors partly explains the relative underperformance.
- Nevertheless, since 2022 year-end, investors priced in future rate cuts which triggered a partial recovery in the index returns.
- Expected interest rate changes are likely to be a significant source of surplus return, as the long end of the curve tightens.
DEFAULTS & RISKS
INFRA DEFAULT RATE SIMILAR TO INVESTMENT GRADE
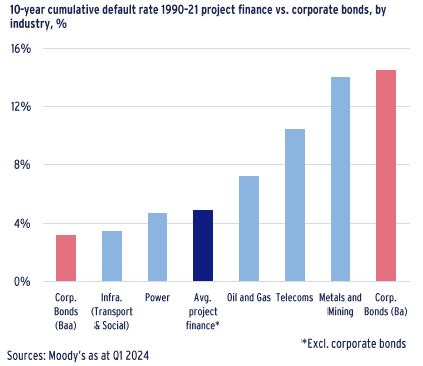
- To compare the risks associated with project finance debt we look at a 10-year cumulative default rate for the loans across the various subsectors originated between 1990 - 2021.
- Project finance typically funds a distinct and strategic activity, with no financial recourse against the sponsor.
- The default rate expresses the share of defaulted loans on or before year 10 from financing as a percentage of total loan originations.
- Based on the Moody’s data, infrastructure (transport & social) has the lowest cumulative default rates of 3% - only slightly above the default rates of investment-grade corporate bonds for the same period.
- The cross-sector project finance average cumulative default rate stands at 5%, just above the Baa corporate bond average.
- Metals and mining as well as telecoms have the highest default rates at 14% and 10%, respectively. This is more in line with the average Ba high yield corporate bond average.
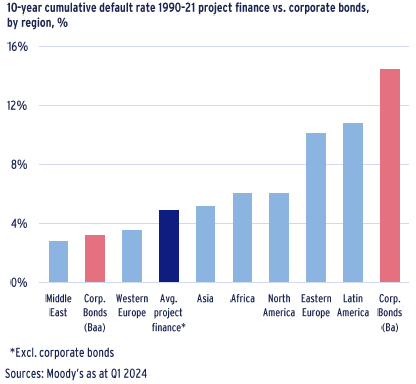
- Project finance default rates also vary across regions.
- Lowest project finance defaults, according to Moody’s data, are loans for Middle East projects at 3% - slightly below the Moody’s investment-grade level debt.
- Western European defaults are very close to these figures with an average rate of 4%, while the average rate globally stands at 5%.
- Asia is in line with the global benchmark with an average default rate of 5%, which is lower than in North America (6%).
- Rest of the world project finance debt cumulative credit default rate lies in a range between 5% and 11%. Still lower than the default rate of 14% for debt graded as speculative by Moody’s.
- Please note, that project finance marginal default rates fall significantly after two years from origination to levels consistent with investment-grade corporate bonds by year seven.
- The drop in the marginal default rates of project finance loans stands in contrast to the broadly stable marginal annual default rates Moody’s have observed for investment-grade corporate bond issuers.
AVERAGE RECOVERY RATES ON DEFAULTED LOANS AT 80%
- In case of a default, average recovery rate for lenders stands at 79%
- Power sector has the highest, and above-average recovery rates of 92%.
- Infrastructure (transport and social) sector has a just below-average rate of 78%
- The sector with the lowest recovery is Metals & Mining, with 61% recovery.
- Nevertheless, the most frequent ultimate recovery rate is 100% — in other words, no economic loss — which is the outcome in 62% of cases of observed defaults.
- Ultimate recovery rates for project finance bank loans are similar to those for senior secured corporate bank loans and overall corporate bank loans.
- The senior secured loans within Moody’s Corporate Bank Loan Data Set averaged a recovery of 83.1% (versus 78.9% for all corporate bank loans) between 1987 and 2021.
WIDE RANGE OF SPREADS HIGHLIGHTS IDIOSYNCRACY
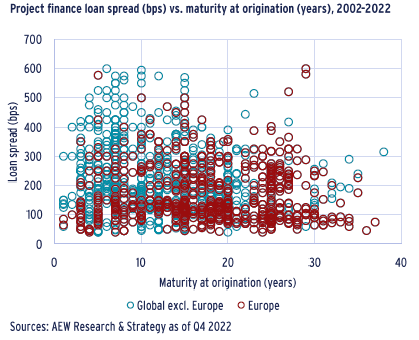
- Our in-house pricing database consists of 2,211 project finance loans that originated between 2001-22 globally, with 45%, or 984 of these loans, targeting projects in Europe.
- Project finance loan spreads vary from as low as 40bps up to 600bps both in Europe and globally.
- Maturity of the loans varies between 1 to 37 years, with an average maturity of 17.5 years. Maturity of the loans does not correlate directly with the margins in our sample.
- Maturities at 7, 10, 15, and 20 years are the most common for the project finance loans.
- Loan spreads shown in the chart are referring to a multitude of reference rates linked to the project jurisdiction including US T-bills and 3-months Euribor. We have not normalized the reference rates or corrected for explicit government guarantee.
- This data confirms the idiosyncrasy of pricing in project finance.
SUBSECTOR MARGINS CONVERGING
- Our in-house loan margin database allows for comparison between broad subsectors and on a moving average basis.
- Transportation has shown the lowest loan margins over the entire period, but renewable margins have come down significantly, as more lenders are keen to expand their exposure to the subsector. Once emerging subsectors such as offshore wind have also become more mature.
- More recently, oil & gas margins have tightened, while telecom and non-renewable power margins have remained elevated.
- High margin volatility, as well as the lack of directly observable relationship with maturity profile and debt-to-equity ratios confirms the idiosyncrasy of project financing.
- The specifics of each individual project plays a key role in the pricing of the loans, which requires a wide network of sourcing and an ability to carefully underwrite risk.
- Across all subsectors we can observe a downward margin trend (on top of lower reference rates) over the last 10 years, as the regulatory framework has allowed for a wider range of non-bank institutions to become active infra lenders.
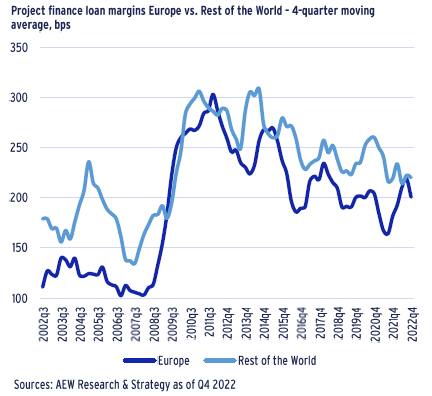
EUROPE’S MARGINS NEARLY 40 BPS LOWER
- Breaking down our margin series geographically shows that European projects have an average spread over their respective reference rates of 191bps.
- On the other hand, the rest of the world’s average infra loan spread reached 229bps.
- Our database is skewed towards OECD countries and therefore does not reflect the margins in higher risk, developing countries.
- This bias makes it difficult to confirm the geographical premium for non-European deals, even if driven by currency or country risk.
- Both series reached minimal values just before the GFC and experienced a strong repricing post-GFC.
- After reaching the peaks in 2011, the margins gradually decreased towards their long-term averages.
- Notably, the Covid pandemic period had a relatively small effect on the margins, especially in Europe.
- These relationships need further investigation as to whether this can be considered a pure geographical effect, or just a function of other underlying factors that concentrate geographically, such as the type of reference rates or projects.
This material is intended for information purposes only and does not constitute investment advice or a recommendation. The information and opinions contained in the material have been compiled or arrived at based upon information obtained from sources believed to be reliable, but we do not guarantee its accuracy, completeness or fairness. Opinions expressed reflect prevailing market conditions and are subject to change. Neither this material, nor any of its contents, may be used for any purpose without the consent and knowledge of AEW. There is no assurance that any prediction, projection or forecast will be realized.