Modern private credit emerged in the wake of the Global Financial Crisis (GFC) and the resulting capital constraints, regulatory and otherwise, of traditional bank financing. Both investor interest in and media coverage of private credit have greatly increased and been overwhelmingly favorable in recent years. Allocators have invested heavily into the asset class, particularly in U.S. middle market corporate direct lending strategies (“direct lending”), the largest component of the private credit universe. And it’s for good reason. Private credit has delivered, providing high contractual income yields at top of the capital stack risk positioning, generating what we believe to be one of the best risk-adjusted returns across public and private markets in recent years. For example, the Cliffwater Direct Lending Index, a measure of U.S. middle market corporate leveraged lending, reported a 9.4% gross of fees annualized total return over the five-year period ending September 30, 2024, a period when short-term interest rates averaged 2.3%.
Direct lending has benefited from both a persistent, albeit tightening, illiquidity premium and accretive leverage. As short-term interest rates rose above 4% in late 2022, leveraged floating rate yields climbed into the low teens, prompting advocates of the asset class to proclaim the “golden age of private credit,” specifically with middle market corporate direct lending in mind – as opposed to loans secured and backed by real assets such as real estate. With short-term interest rates now seemingly declining, investors are questioning whether direct lending remains as attractive or if other areas of private credit may now provide better relative value.
Asset-based finance is one area of private credit that is growing quickly in popularity. Many investment managers and members of the media have gone so far as to label it the next golden age, citing bank retrenchment as the primary driver of opportunity. While potential changes to the bank regulatory environment may encourage risk to move to non-bank lenders, this outcome is far from certain. As such, we remain skeptical of the claim that bank retrenchment will create enduring trends for the private markets to capitalize on all facets of asset-based finance. Rather than relying on catalytic regulatory changes, opportunities that align with long-term shifts in supply and demand—much like what we’ve seen in the golden age of direct lending—can provide investors with sustained, above-average returns. We believe that private commercial real estate debt is currently one of these opportunities, highlighted by its scale and already demonstrated market shifts.
Figure 1
Google Search Trend for Private Credit
Index = 100 at Point of Greatest Number of Searches

Source: Google Trends, as of February 2025
The Asset-Based Finance Market – Relative Value
The U.S. asset-based finance market is an estimated four times larger than the leveraged finance market, though we believe that scale is available in only three categories: 1) residential mortgages; 2) commercial real estate lending; and 3) consumer finance (automobiles, credit cards, and loans) which collectively represent 92% of the estimated $26 trillion U.S. market. These “big three” are dominated by banks. The remaining asset-based finance categories (e.g., solar, rail, aircraft, litigation finance, etc.), are significantly smaller and largely have substantial non-bank finance involvement already, potentially limiting the opportunity for investors.
Of the “big three,” we believe commercial real estate lending offers the best opportunity from bank disintermediation, even absent regulatory change. This is in somewhat contrast to residential mortgages or consumer finance, two business segments that have also historically been profitable and are closely protected by U.S. government agencies since the GFC. Regulators seem unwilling to push these important consumer lending relationships outside of the banking system. Even prior to the 2024 election, regulators were rolling back the severity of any potential bank capital treatment changes aimed at consumers if Basel III Endgame is implemented. Under the reproposed regulation, performing residential mortgages and consumer lending will receive more favorable capital treatment than under existing regulations. In contrast, while regulators are easing the capital impact on consumer lending activities, they have been quiet on any public announcements to the proposed regulation for commercial real estate lending while privately evaluating commercial real estate holdings through stress tests, on-site examinations, and off-site monitoring.
Figure 2
Composition of U.S. Asset-Based Finance Market

Source: Oliver Wyman, as of April 2024
Composition of U.S. CRE and Residential Mortgages Market

Source: Federal Reserve, as of December 2024
Given this heightened regulatory environment, it is unsurprising that bank activity in commercial real estate lending has fallen dramatically even without regulatory changes. Bank market share of non-agency real estate loan originations is down from nearly 50% in Q3 2022 to just 18% in Q3 2024 despite the extreme decline in transaction volumes, down more than 60% from their trailing twelve months peak in mid-2022. Life insurers have captured this shift in market share to date, but we suspect they will not be able to keep this same share as transaction volumes recover for two reasons. First, life insurers are already heavily exposed to commercial mortgages, so there are capacity constraints to a material increase in their allocation to the asset class. Second, we believe borrowers will decreasingly favor the fixed rate loan options commonly offered by life insurers due to the yield curve uninverting, making floating rate loans from alternative lenders more attractive. With all-in borrowing rates still high, we believe borrowers will avoid locking in a long-term fixed rate with minimal prepayment flexibility from a life insurer, especially when the market is forecasting additional interest rate cuts in 2025 that would benefit borrowers of floating rate loans.
Alternative lenders held their market share over the past two years. We view this as a relative accomplishment given the lack of activity from mortgage REITs, the near shutdown of the CRE collateralized loan obligation market and the uninspiring fundraising across real estate strategies during this period. If banks do not return to their prior lending behaviors, a funding gap will likely persist as transaction volumes recover, and alternative lenders can be best positioned to be share takers as it does.
Figure 3
Composition of Non-Agency Commercial Real Estate Loan Closings (Q3 2022 to Q3 2024)

Source: CBRE
Let’s be clear though, the banks aren’t going anywhere long-term in commercial real estate lending. Banks are two years in to working through criticized loans, and there are green shoots emerging from their slow return to lending. However, if this cycle is like others in the past, it will be many years more before banks return to their prior lending activity, regulation aside. Where banks are selectively active today, we believe it is primarily to balance their portfolios. Better performing loans have refinanced elsewhere, and as a result, subperforming loans represent an increasing percentage of bank commercial real estate exposure. We believe banks will become increasingly active as their troubled loans are resolved, but this resolution may take longer than expected.
As shown in Figure 4, practically all lenders have “kicked the can” on loan maturities over the past two years. Banks and others have addressed a challenging real estate environment in a responsible manner, working with borrowers to provide needed time for business plans to be executed and liquidity to return to the market. The wall of maturities has not disappeared though, and until it does, we believe alternative lenders have a window to gain market share, in many cases with new debt capital provided on re-priced collateral. But whether it is three years, five years, or longer, the banks will return. To us, the only questions are how and to what scale.
Figure 4
Comparison of Scheduled Loan Maturities: 2023, 2024 and 2025 Surveys

Source: Mortgage Bankers Association
As to how, we believe it will largely be in partnership with alternative lenders similar to the many recently announced partnerships between banks and direct lenders in the corporate middle market lending segment. Simply put, we do not believe regulators want banks holding last dollar risk, even if it has been historically a profitable endeavor. From a pure economic perspective, bank management and shareholders want to prioritize return on equity, and that is not accomplished via commercial mortgage lending today and likely will be further dilutive to shareholder returns with any new regulation. Instead, both regulatory and profitability pressures lead to a transformation from balance sheet lending to repo or note-on-note lending (i.e., portfolio finance). Figure 5 highlights how portfolio lending drives better profitability.
Figure 5
Bank Profitability Analysis of Balance Sheet Lending Versus Repo Financing
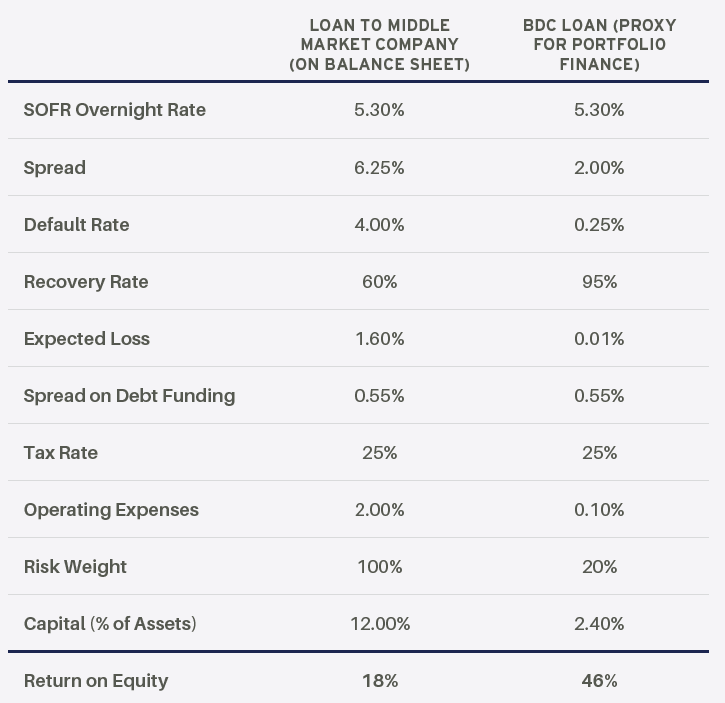
Source: Bank Capital and the Growth of Private Credit. Chernenko, Ialenti, Scharfstein. September 2024
As to the scale of this opportunity, we note that banks have maintained a +/- 50% market share of all commercial and multifamily mortgages for decades. Today, their holdings total nearly $3 trillion. Banks hold an even larger share of floating rate mortgages where we estimate they compose more than 80% of the market. It is impossible to forecast market share a decade from now with any accuracy. However, even a 1% change in market share ($59 billion) is greater than all of the dry powder that currently exists for real estate debt strategies. If recent trends continue and the precedent of banks fleeing the leveraged finance market after the GFC are repeated with commercial real estate lending, the market share transitioning from banks will be much higher and long lasting.
Figure 6
Market Share of U.S. Commercial and Multifamily Mortgages as of Q3 2024

Source: Federal Reserve
With current stress introduced by commercial real estate assets repricing, higher debt costs, expiring interest rate caps and (still) more than $2 trillion in looming loan maturities, commercial real estate lending presents not only a scale opportunity for private credit but one that has multiple catalysts for monumental market movements in the near term.
For these reasons, we believe commercial real estate debt, specifically senior floating rate loan strategies that directly capitalize on the transition from banks to private credit, deserve consideration today more than ever. With the current interest rate, loan spread and accretive leverage environment, we believe this next decade for commercial real estate debt may be even more profitable than the one that followed the GFC.
Figure 7
Aggregate Change in Property Values from Prior Peak
Green Street Commercial Property Price Index (4Q21=100)

Source: Green Street
Key Qualities of Commercial Real Estate Debt
Investors allocate to commercial real estate debt across real estate, private credit and fixed income portfolios. Each allocation has merit because commercial real estate debt can provide a variety of benefits to each portfolio, highlighted by credit quality, diversification, illiquidity premium and control.
Credit Quality
Access to creditworthy loans is critical to long-term success in credit investing. Most loans offer no upside participation, making loss avoidance a priority. In other words, capture the market spread (or better) and avoid diluting your cash yield with principal loss. Credit ratings are a fundamental indicator of credit risk and highly correlated with default probability.
While we believe value can be found investing across the credit risk spectrum, commercial real estate lending offers investors the opportunity to upgrade the credit quality of their portfolios, especially today after the reset in real estate collateral values. Direct lending tends to cluster around a B- rating, with 69% of KBRA’s surveillance assessments rating as B- or lower as of Q3 2024. These ratings indicate highly leveraged borrowers that have little room for error in operations. Whereas direct lending primarily offers credit ratings four to six notches below investment grade, we have found commercial real estate mortgages to consistently rate as investment grade on an implied credit rating basis in today’s environment. The hard collateral of real estate is disproportionately rewarded in implied credit ratings versus the collateral packages of corporate borrowers, which may consist of accounts receivables, inventory, and property, plant and equipment, which typically have less reliable collateral value than real estate during a liquidation event, leading to a greater potential for principal loss.
Diversification
A quarterly time series of returns from Q1 2010 through Q2 2024 (the broadest period available for floating rate commercial real estate lending) reveals sustainable diversification benefits of commercial real estate debt versus fixed income and alternative credit. Over nearly 15 years of data, the Giliberto-Levy High-Yield Real Estate Debt Index (“G-L 2 Index”) has shown to be uncorrelated with practically all of fixed income. Correlations have ranged from 0.07 to (0.05) across investment grade and high yield corporates, commercial mortgage backed securities (CMBS) and leveraged loans. Meanwhile, the Morningstar LSTA US Leveraged Loan Index (“Leveraged Loan Index”), which we view as a publicly available proxy for direct lending, has a high correlation of 0.90 to the Bloomberg US Corporate High Yield Total Return Index (“High Yield Index”) despite the difference in base rates of the indices, with leveraged loans held as floating rate loans and high yield as fixed rate bonds.
As shown by the G-L 2 Index, floating rate commercial real estate bridge loans have also historically provided diversification benefits to real estate equity portfolios, with no recorded correlation across a nearly 15-year time series of returns between the G-L 2 Index and the NCREIF Open End Diversified Core Equity Index (NFI-ODCE). Importantly, this diversification benefit has come with little to no sacrifice in return relative to real estate core equity strategies. Over the past 14.5 years, commercial real estate debt has generated an annualized return of 8.34% versus 8.69% for the NFI-ODCE gross of fees.
If past correlation patterns hold, adding commercial real estate debt to fixed income, real estate or private credit allocations can improve risk-adjusted returns.
Illiquidity Premium
Privately originated commercial real estate mortgages have demonstrated substantial return benefits over publicly available fixed income, with the G-L 2 Index outperforming the Bloomberg U.S. CMBS (ERISA Only) Index by 4.28% per annum, the High Yield Index by 2.06% and the Leveraged Loan Index by 3.17% per annum over nearly 15 years. The index comparisons are imperfect, but there is a persistent yield and total return benefit over multiple market cycles that we believe remains attractive even after leverage and fees are removed. We view this illiquidity premium as outsized since commercial real estate bridge loans are typically three to five years in tenor before repayment is due.
Although these illiquidity premiums have held over longer periods of time, there are variations between real estate lending and leveraged loans over shorter periods of time due to the lack of correlation between the strategies. As of Q2 2024, it is noteworthy that leveraged loans are outperforming commercial real estate debt to a degree only seen once before in the time series.
The time series has shown a consistent mean reversion pattern since inception, so commercial real estate debt will benefit in the years ahead if the pattern continues, offering an attractive entry point for the asset class today, particularly for private credit portfolios, which typically carry a high exposure to corporate lending.
Figure 8
Rolling One-Year Returns: Giliberto-Levy 2 (High Yield Real Estate Financing) versus Leveraged Loan Index

Source: Giliberto-Levy, LCD Pitchbook
Control
Direct lending strategies credibly offer better control elements via covenants than the high yield or leveraged loan markets, which are mostly covenant-lite. We believe commercial real estate lending strategies take control measures even further to the benefit of investors. Control comes in various forms, but we view commercial real estate lending as harnessing two advantages over direct lending in influencing outcomes: fewer club deals and easier optionality to own due to the commodity-like nature of the collateral.
Despite the explosive growth of direct lending as an asset class, club deals are becoming more common as highlighted by Figure 9 reporting more lenders per facility, averaging 2.5 lenders per loan. Commercial real estate bridge lending tends to be financed using bilateral loan agreements between a single borrower and single lender.
Figure 9
Average Number of Lenders in a Single Loan Facility

Source: Federal Reserve, as of February 2024
Control matters in a workout. We believe bilateral loans offer greater speed of execution and negotiating leverage than a club arrangement. Clubs may introduce misalignment between the lenders in terms of time horizon, expertise, risk tolerance and capacity. We believe better control is one reason there are fewer instances of “creditor-on-creditor violence” and liability management exercises in commercial real estate lending than in corporate lending.
A key difference between commercial real estate lending and direct lending is the ease at which a foreclosure and subsequent operations of collateral can occur. Commercial real estate is largely a commodity product. If you have the market presence, operating expertise, and relationships to own and operate on your equity platform, it is nearly seamless to transition a property from debt-to-equity ownership. Private corporations are more diverse, hands-on and often require specialized expertise, potentially complicating borrower negotiations and limiting the options available to a lender. As a result, we believe real estate lending maximizes the opportunity for recovery rate.
Outlook for Commercial Property
Commercial real estate has felt the impact of rising interest rates as much if not more than other asset classes. Over the past two years, U.S. commercial property values recorded an average decline in value of approximately 20% despite positive operating results, with property net operating income increasing approximately 10%. Over this same period, the average property capitalization rate (yield) has increased by approximately 100 basis points. This yield effect, by itself, would account for more than a 25% decline in the value of constant property income.
After a challenging past two years, there is renewed optimism in commercial real estate investing.
- There is reason to believe that values are near or past a bottom.
- Fundamentals, although weaker than their 2021 peak, have surprised to the upside across most sectors.
- Short-term interest rates have declined modestly, lowering interest payments and interest rate cap costs for floating rate borrowers.
- Capital markets liquidity has returned for stabilized assets and fixed rate borrowers.
- The bid-ask spread has narrowed, paving the way for more transactions.
While none of these factors are flashing the “all clear” sign yet, each one suggests brighter days ahead for the asset class. With frothy valuations across equity markets and near record low credit spreads across fixed income, we believe real estate offers better relative value today than it has in years.
Commercial real estate debt may offer the best value of all within the asset class—high cash yields, access to accretive leverage, meaningful equity subordination on repriced collateral, risk mitigation via covenants and limited illiquidity. Loan demand for refinance and construction is strong, and demand for acquisition financing is improving. We believe floating rate loans will be in greater demand now that the yield curve is uninverting. There is adequate dry powder for low transaction volumes, but it should be exhausted quickly with the real estate market stabilizing.
We believe commercial real estate debt offers undeniable portfolio benefits and can deliver outsized risk-adjusted returns to investors for years to come as the real estate market stabilizes. Whether you’re a fixed income, real estate or private credit investor, we encourage you to take a fresh look at commercial real estate debt.
Figure 10
Change in Capital Value, Net Operating Income, and Cap Rate from Peak

Source: NCREIF
For more information, please contact:
JUSTIN PINCKNEY, CFA®
Head of Private Debt
justin.pinckney@aew.com
+1.617.261.9178
This material is intended for information purposes only and does not constitute investment advice or a recommendation. The information and opinions contained in the material have been compiled or arrived at based upon information obtained from sources believed to be reliable, but we do not guarantee its accuracy, completeness or fairness. Opinions expressed reflect prevailing market conditions and are subject to change. Neither this material, nor any of its contents, may be used for any purpose without the consent and knowledge of AEW. There is no assurance that any prediction, projection or forecast will be realized.
CFA® and Chartered Financial Analyst® are registered trademarks owned by the CFA Institute
