Demand remained robust through the first half of 2024 with momentum expected to carry forward over the long-term. Demographics and the need for non-family care providers are pushing demand at a time when construction of new product is at historic lows. Acceptance of the product has proven out even after a global health crisis that had severe impacts on the elderly. The pace of residents moving into seniors housing over the past two plus years is twice the average pace of the previous decade, bringing occupancies to within 70 basis points (bps) of pre-pandemic levels. New studies have helped confirm the health benefits of living in a seniors housing community. The primary headwind facing the sector, and commercial real estate more broadly, remains the capital markets that have clearly altered the current valuation landscape, presenting challenges for owners that lack time and/or the resources to fully participate in the recovery. Correspondingly, we believe an attractive opportunity exists for putting new capital to work in a market where liquidity and access to financing is constrained. These dynamics remained evident in the second quarter given the absence of a more robust transaction environment as the underlying demand recovery continued and expense growth normalized, generating double-digit NOI growth.
Occupancies climbed 60 bps in the second quarter, averaging 86.6% across the 99 primary and secondary markets tracked by the National Investment Center for Seniors Housing & Care (NIC). Demand has been broad based by unit type, acuity level, geography and asset quality, albeit not uniform. While higher acuity assets maintain a lower overall occupancy, majority assisted living assets were 85.0% occupied in the second quarter, eclipsing pre-pandemic levels — a notable milestone. Stated differently, all occupancy lost during the pandemic has been reclaimed. After accounting for new construction, overall occupied inventory has expanded by approximately 7% highlighting the secular strength in underlying demand, which we anticipate will continue. Majority independent properties saw occupancies climb 50 bps to 88.0%. By unit type, demand for memory care units has materially outpaced the other segments on a percentage basis and represents about 15% of all seniors housing units. Across markets, roughly half have now achieved pre-COVID occupancy levels with smaller markets doing somewhat better as they avoided the more pronounced overbuilding that occurred in larger growth markets earlier in the cycle.
SENIORS HOUSING DEMAND GROWTH: PRIMARY AND SECONDARY MARKETS
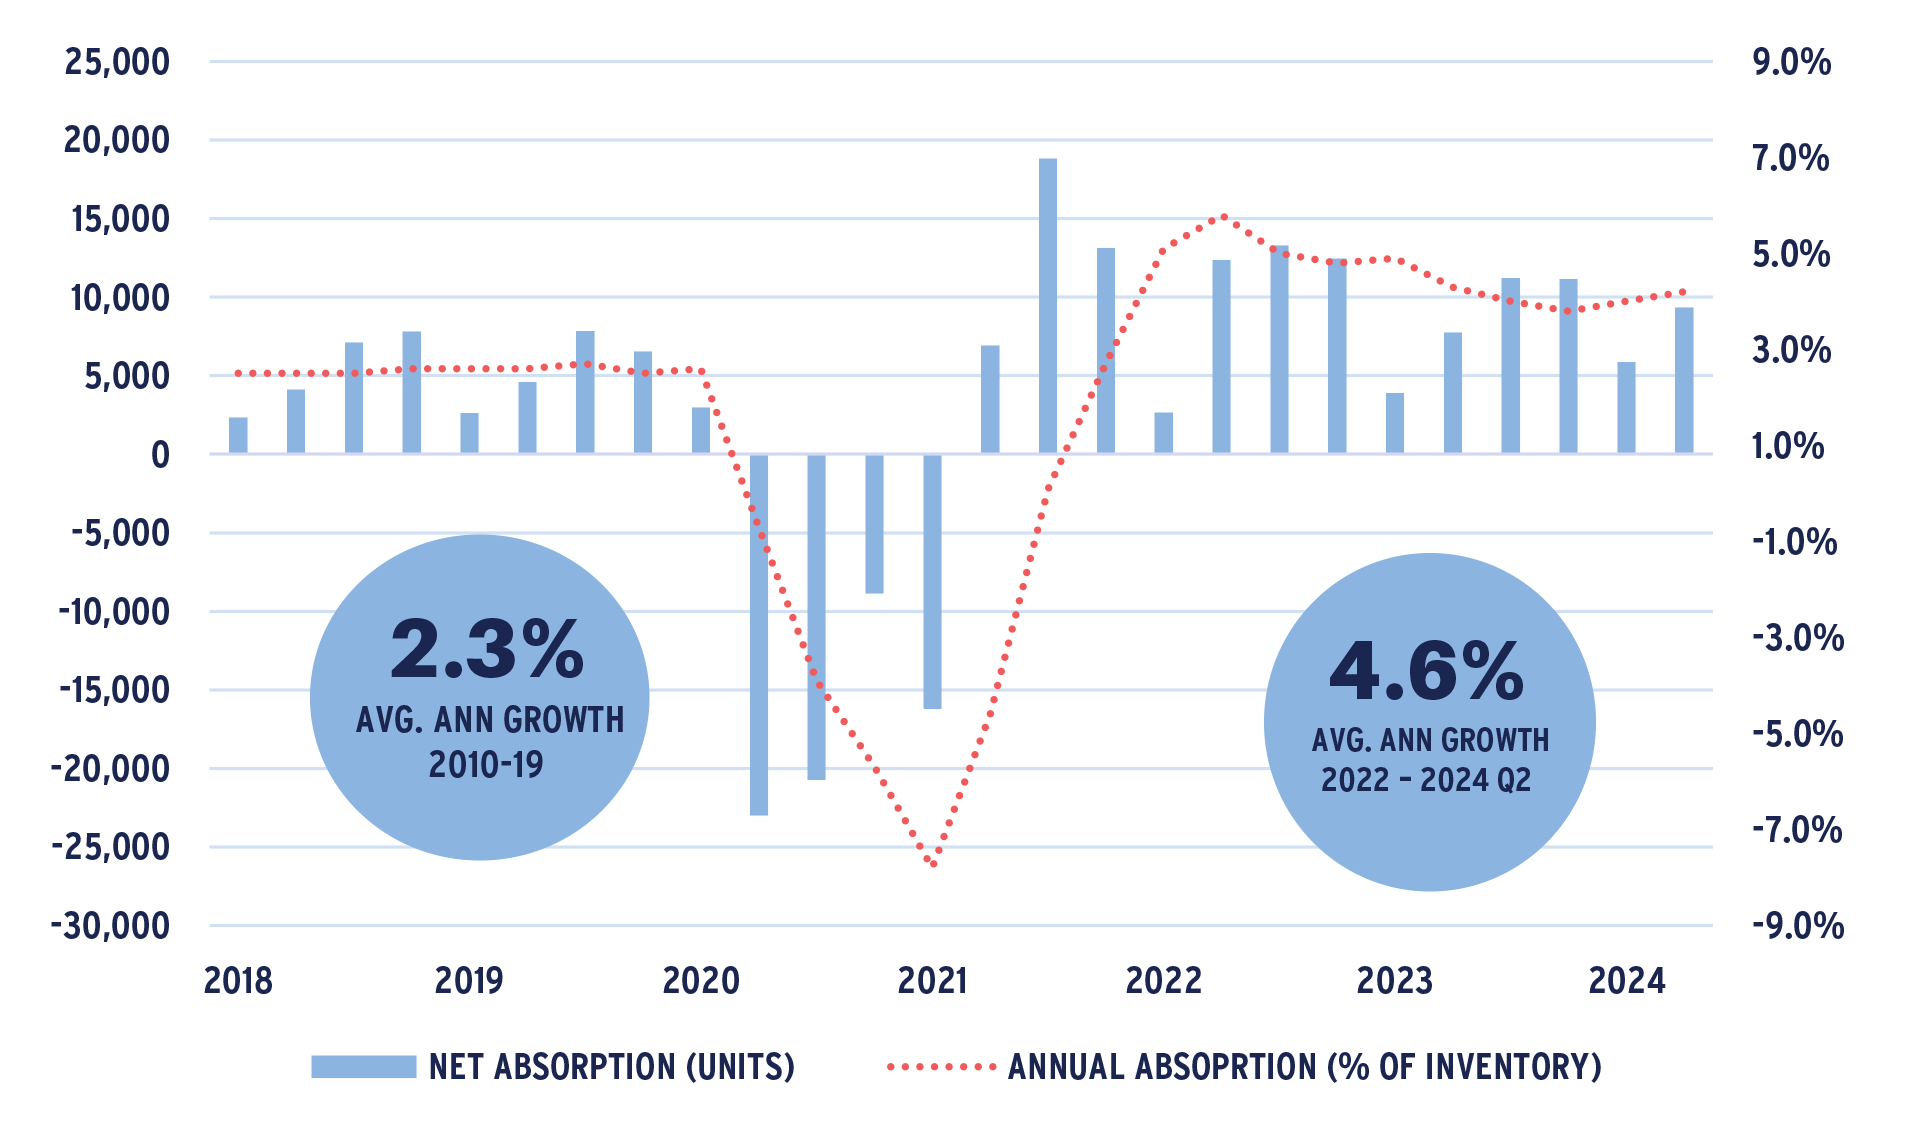
Source: NIC Map Data Service
As of Q2 2024
SENIORS HOUSING FUNDAMENTALS TREND: PRIMARY AND SECONDARY MARKETS
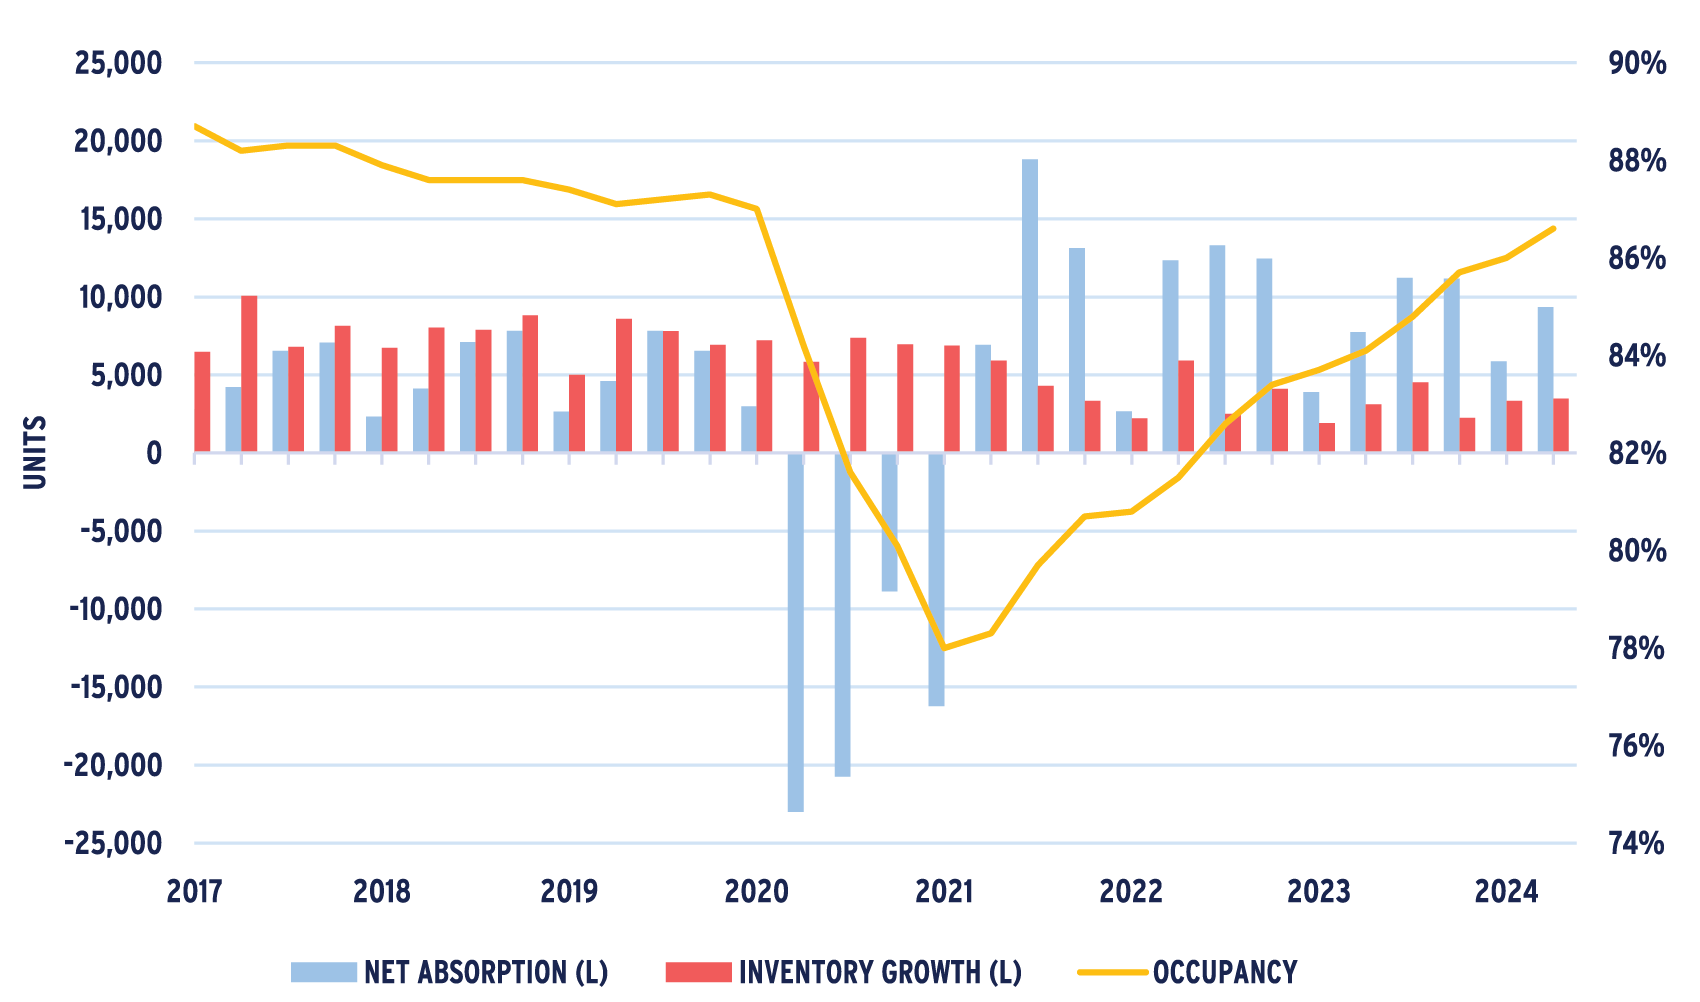
Source: NIC Map Data Service
As of Q2 2024
SENIORS HOUSING MARKET FUNDAMENTALS: PRIMARY AND SECONDARY MARKETS

Source: NIC Map Data Service
As of Q2 2024
The share of properties operating above 90% occupancy has been steadily increasing throughout the recovery. In the second quarter, half of all assets reached this level with the median occupancy rate hitting 90%. The implication is certainly positive for being able to maintain healthy rent growth. That said, a material share of assets are still operating at or below 80%, highlighting a bifurcation in asset performance. Underperformance reflects a mix of aging assets, as well as newer assets facing lease-up challenges, often linked to local oversupply, underperforming operators, or a waning capital commitment from the sponsor. Newly delivered assets are also a factor but represent a declining component as the construction pipeline unwinds.
The story remains unchanged on the supply side with limited new projects breaking ground as financing is absent and the relative return-on-cost to buying existing assets remains unattractive. Over the past year, the pace of new construction has fallen to roughly 12,300 units, or 1.1% of existing inventory, with demand running above 4.0% annually. While subject to revision, only 1,316 units broke ground in the second quarter, highlighting the continued constraints on supply across all primary and secondary markets tracked by NIC.
SENIORS HOUSING CONSTRUCTION STARTS (ROLLING 4-QUARTER, UNITS)
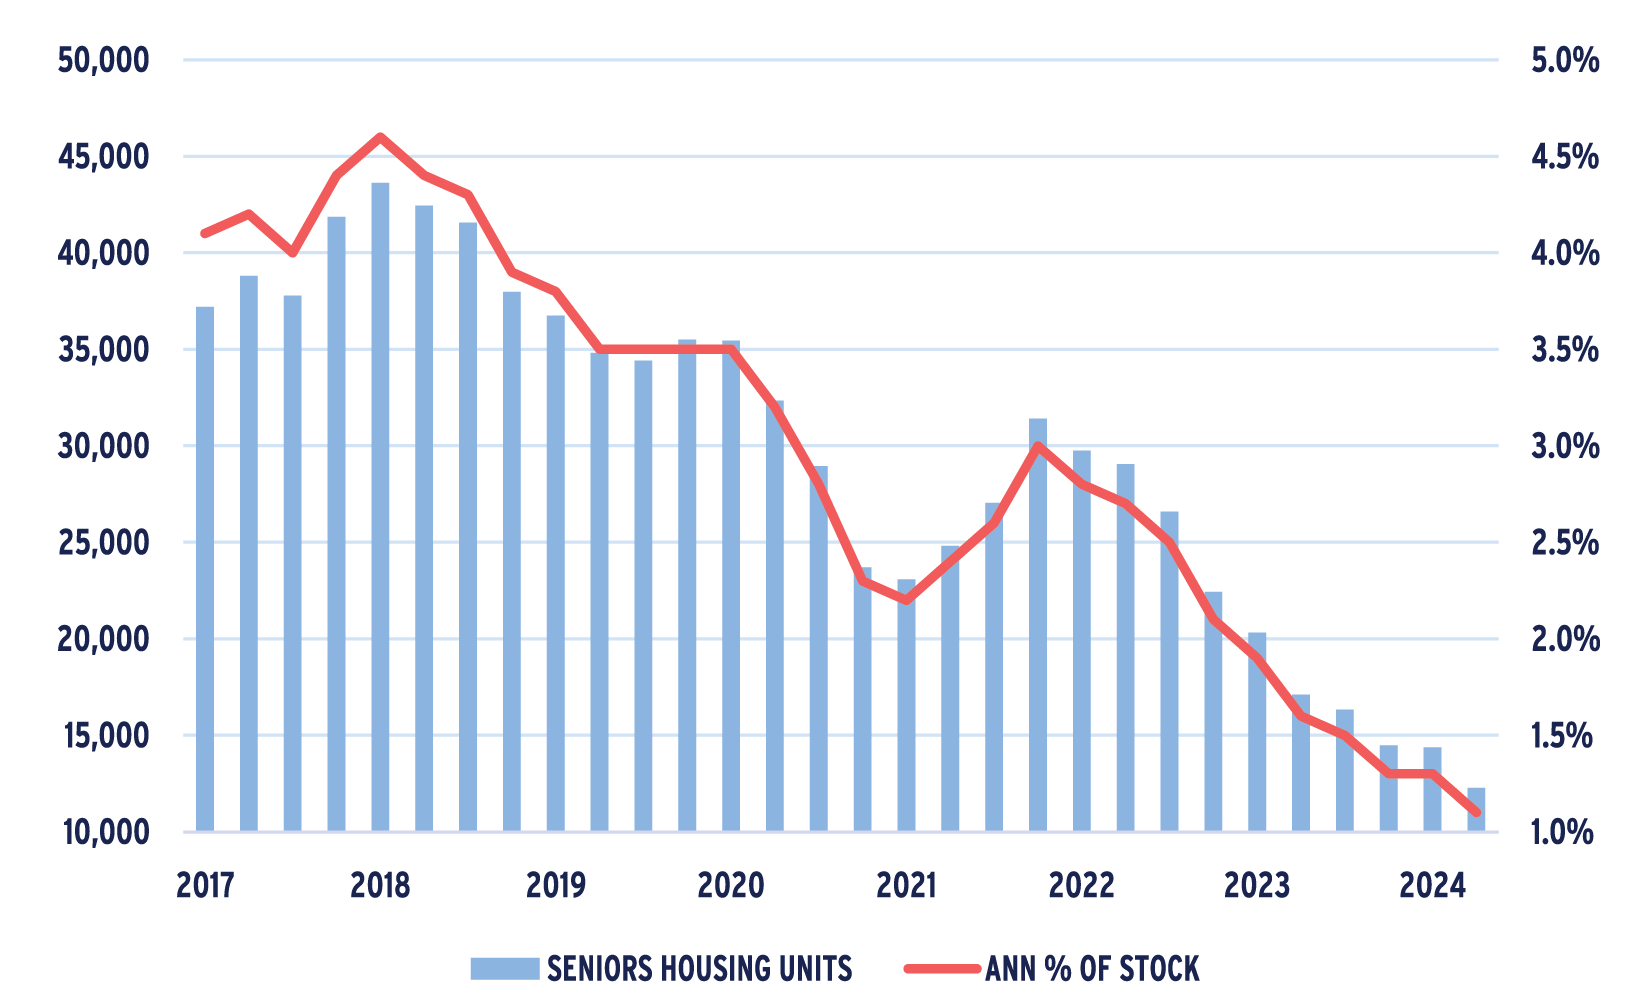
Source: NIC Map Data Service
As of Q2 2024
Rent growth has moderated somewhat from earlier in the recovery when inflationary pressures were at a peak, but operators continue to demonstrate an ability to pass through mid-to-high single-digit increases. Given the tighter leasing market, the ability to adjust rents (including care charges) has become more dynamic with operators better able to optimize revenue per occupied room (RevPOR). Through mid-year, rental and revenue increases are meeting or exceeding budgeted levels with pricing power remaining solidly in place. Operating expense pressures have also moderated as labor dynamics improve, helping to drive NOI growth well into the double digits, creating margin expansion. The use of contract labor and the ability to manage overtime has fallen more in line with pre-pandemic operating norms. That said, wage and cost pressures remain a likely governor on driving NOI and margins while top-line revenue demonstrates ongoing strength.
The capital markets and a restrictive lending environment remain the most significant challenge to liquidity. Transaction volume dropped in the second quarter to $1.2 billion after some momentum to end the year. Activity through the first half of the year is pacing 11% behind last year, which in turn was well-off normalized levels. Pricing on a per-unit basis has fallen in 2024, which seems as much a reflection of asset quality as overall market forces, although cap rates are holding steady. Public REITs were the most active net buyers along with private owners, while institutional capital remained more on the sideline as a net seller. Select deals are still transacting, typically on an all-cash basis although the agencies have shown interest in best-in-class, stabilized, core assets given the relative yields albeit at conservative proceeds. For top sponsors working with quality operators, existing lenders have shown a willingness work with owners on assets that can demonstrate a path forward despite overall pressures to reduce CRE exposure, including seniors housing. Debt funds are also active and are and can be the best for non-recourse bridge financing at a notably higher cost although there has been recent evidence of a narrowing in spreads.
SENIORS HOUSING TRANSACTION VOLUME
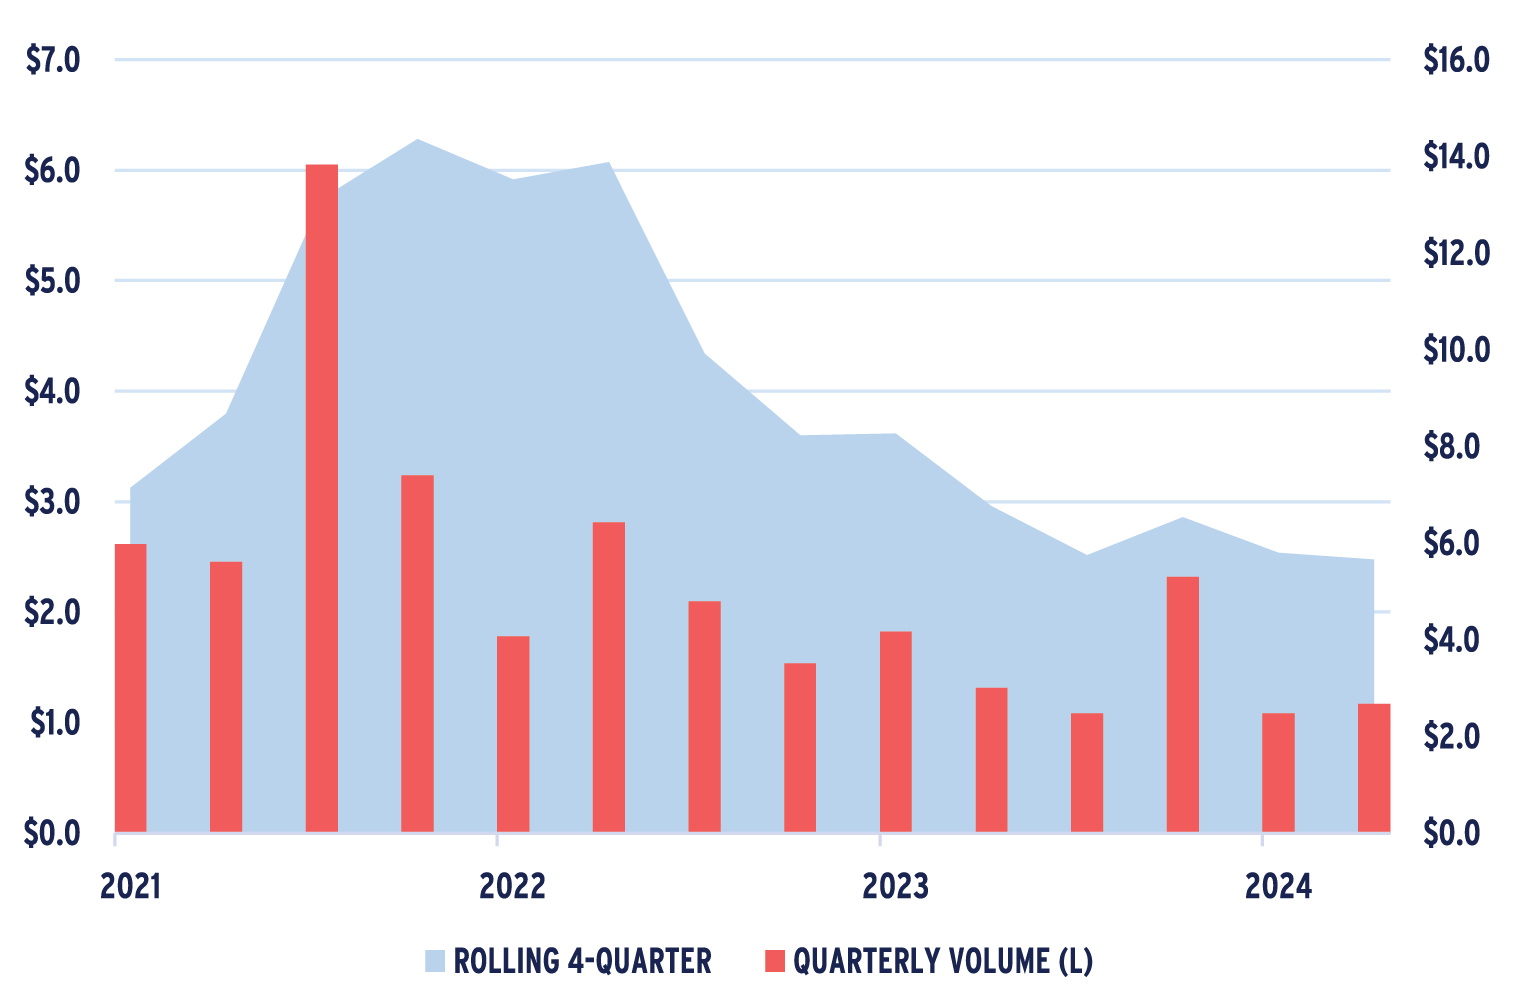
Source: MSCI/RCA
As of Q2 2024
Overall, the second quarter was an extension of what has been in place over the past year or more. Capital market dynamics continue to weigh on assets and portfolios that were constructed at peak valuations with variable rate debt when borrowing costs reflected a different rate environment. Still, the strength of the underlying fundamentals driving top-line revenue growth will likely present an attractive path forward, all at a time when building new product remains constrained. The sector is in solid recovery mode with margins improving and NOIs growing at a healthy double-digit pace as they work their way back toward previously stabilized levels. With each passing quarter the income picture improves with the bigger challenge for owners linked to the debt and capital markets. Those without the luxury of time or the ability to manage their capital stack face a higher level of urgency. The FOMC’s posture of holding firm on rates, especially with the economy surprising to the upside, remains one of the biggest disruptors for seniors housing and CRE more broadly. We believe it is times like these that can present some of the more attractive opportunities for putting new capital to work.
NET TRANSACTION VOLUME BY INVESTOR TYPE ($BILLIONS)
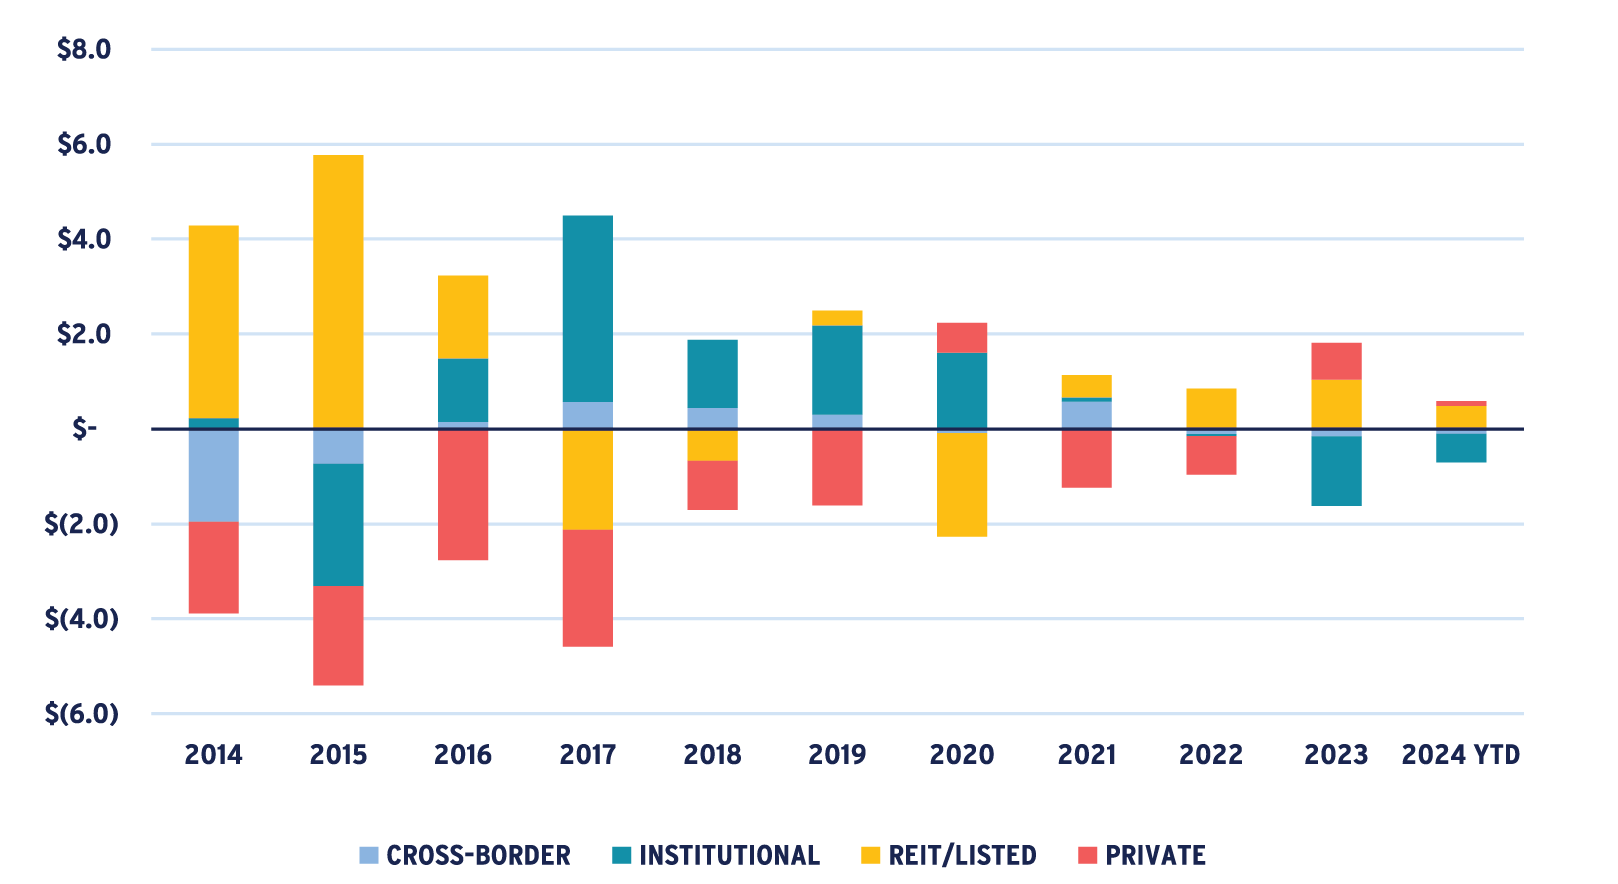
Source: MSCI/RCA
As of Q2 2024
This material is intended for information purposes only and does not constitute investment advice or a recommendation. The information and opinions contained in the material have been compiled or arrived at based upon information obtained from sources believed to be reliable, but we do not guarantee its accuracy, completeness or fairness. Opinions expressed reflect prevailing market conditions and are subject to change. Neither this material, nor any of its contents, may be used for any purpose without the consent and knowledge of AEW. There is no assurance that any prediction, projection or forecast will be realized.
