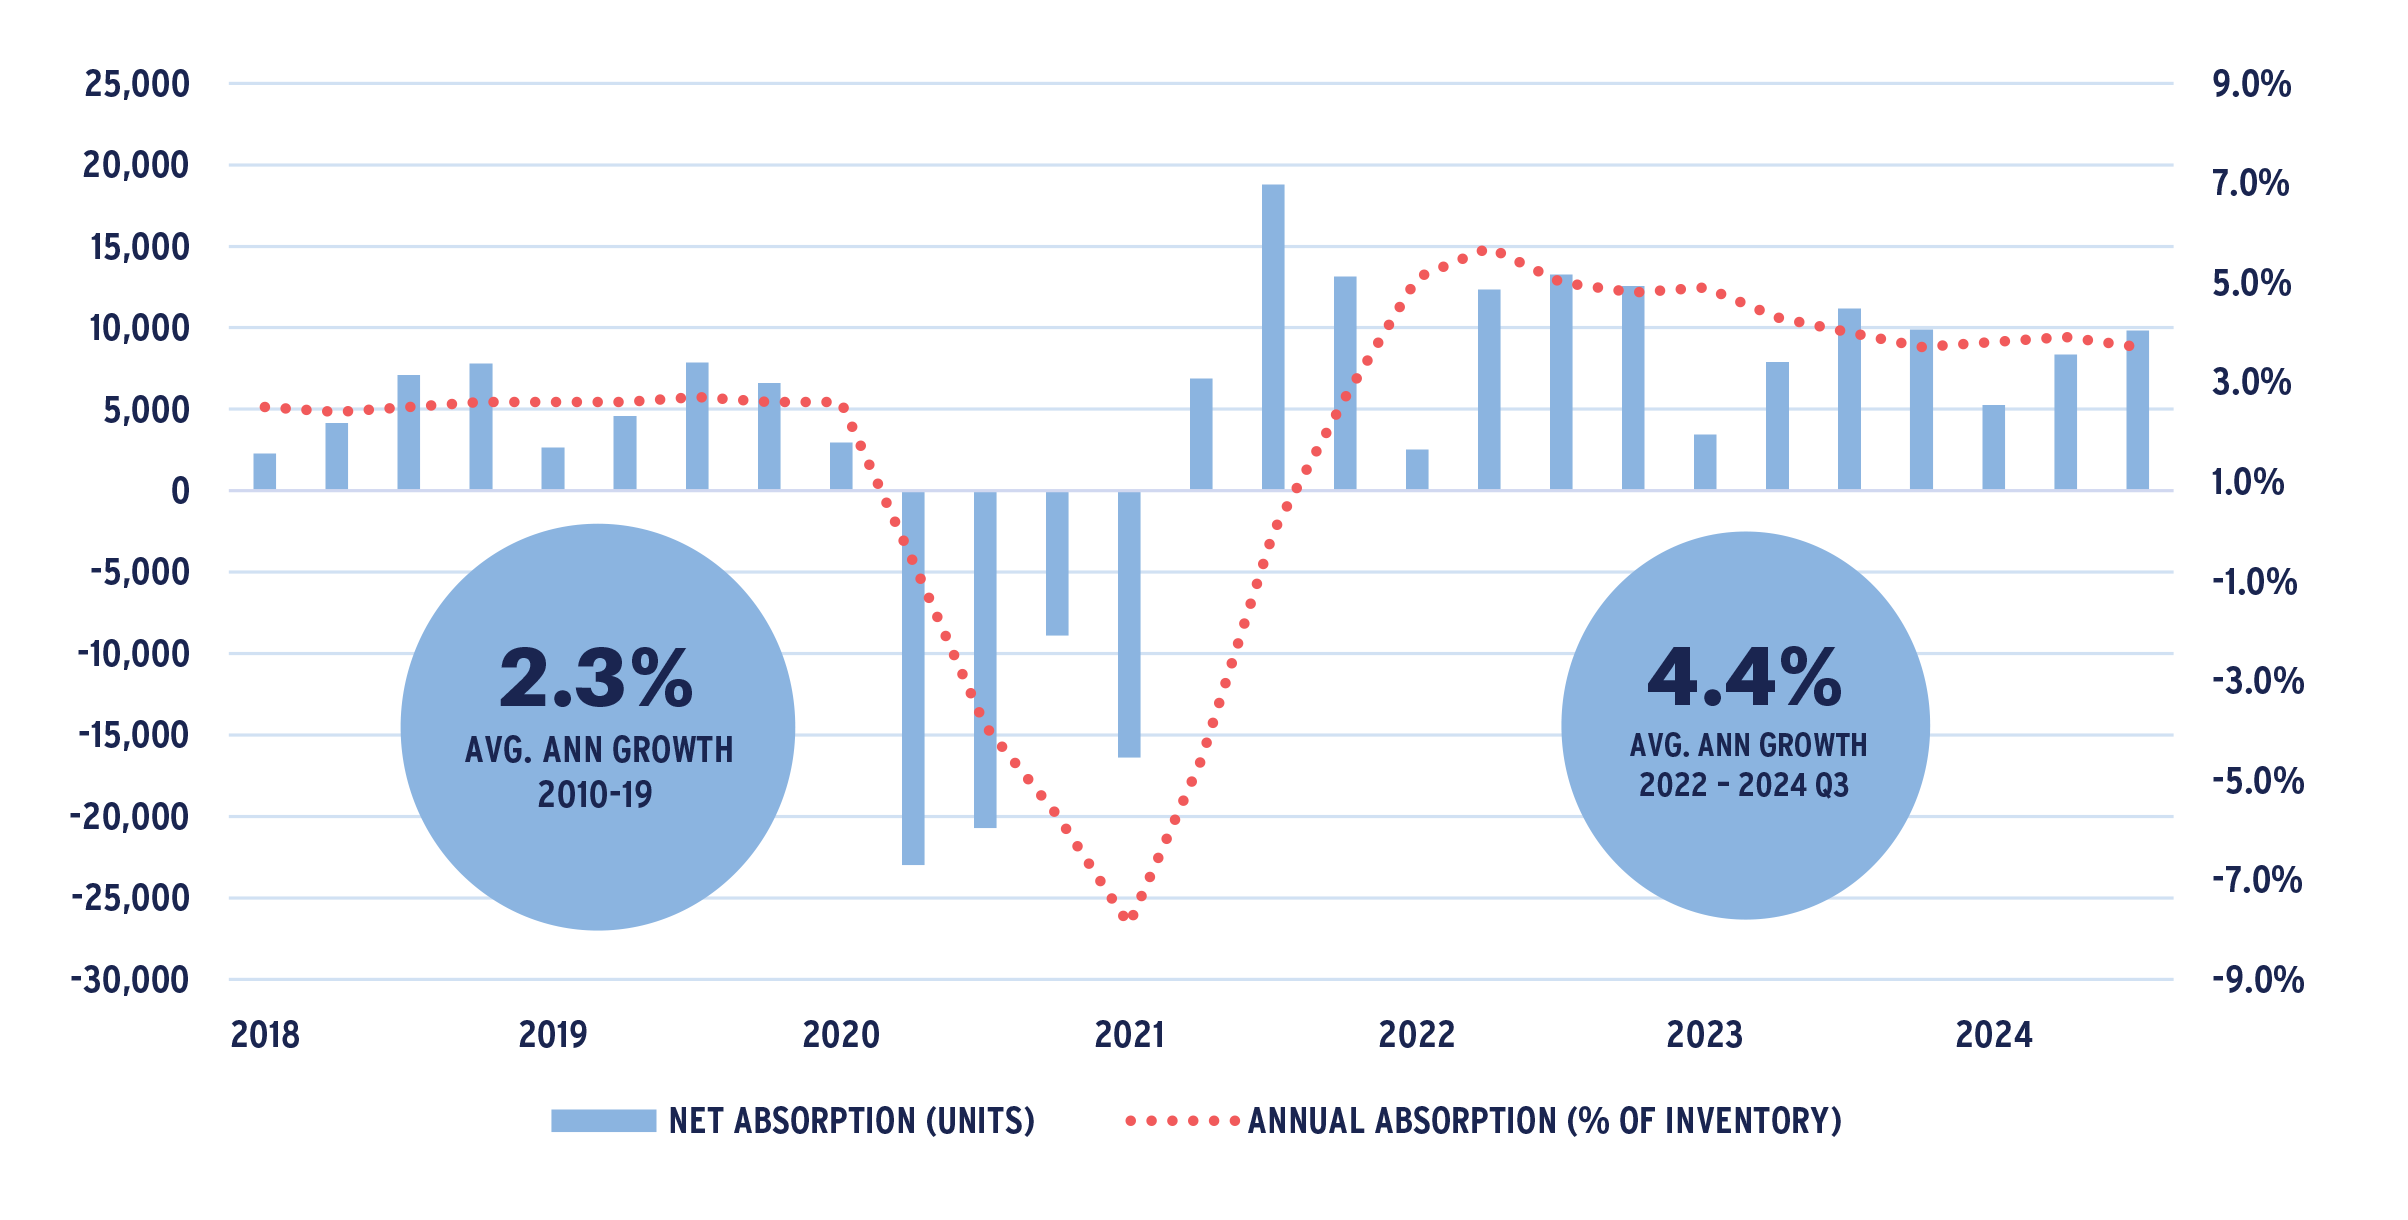
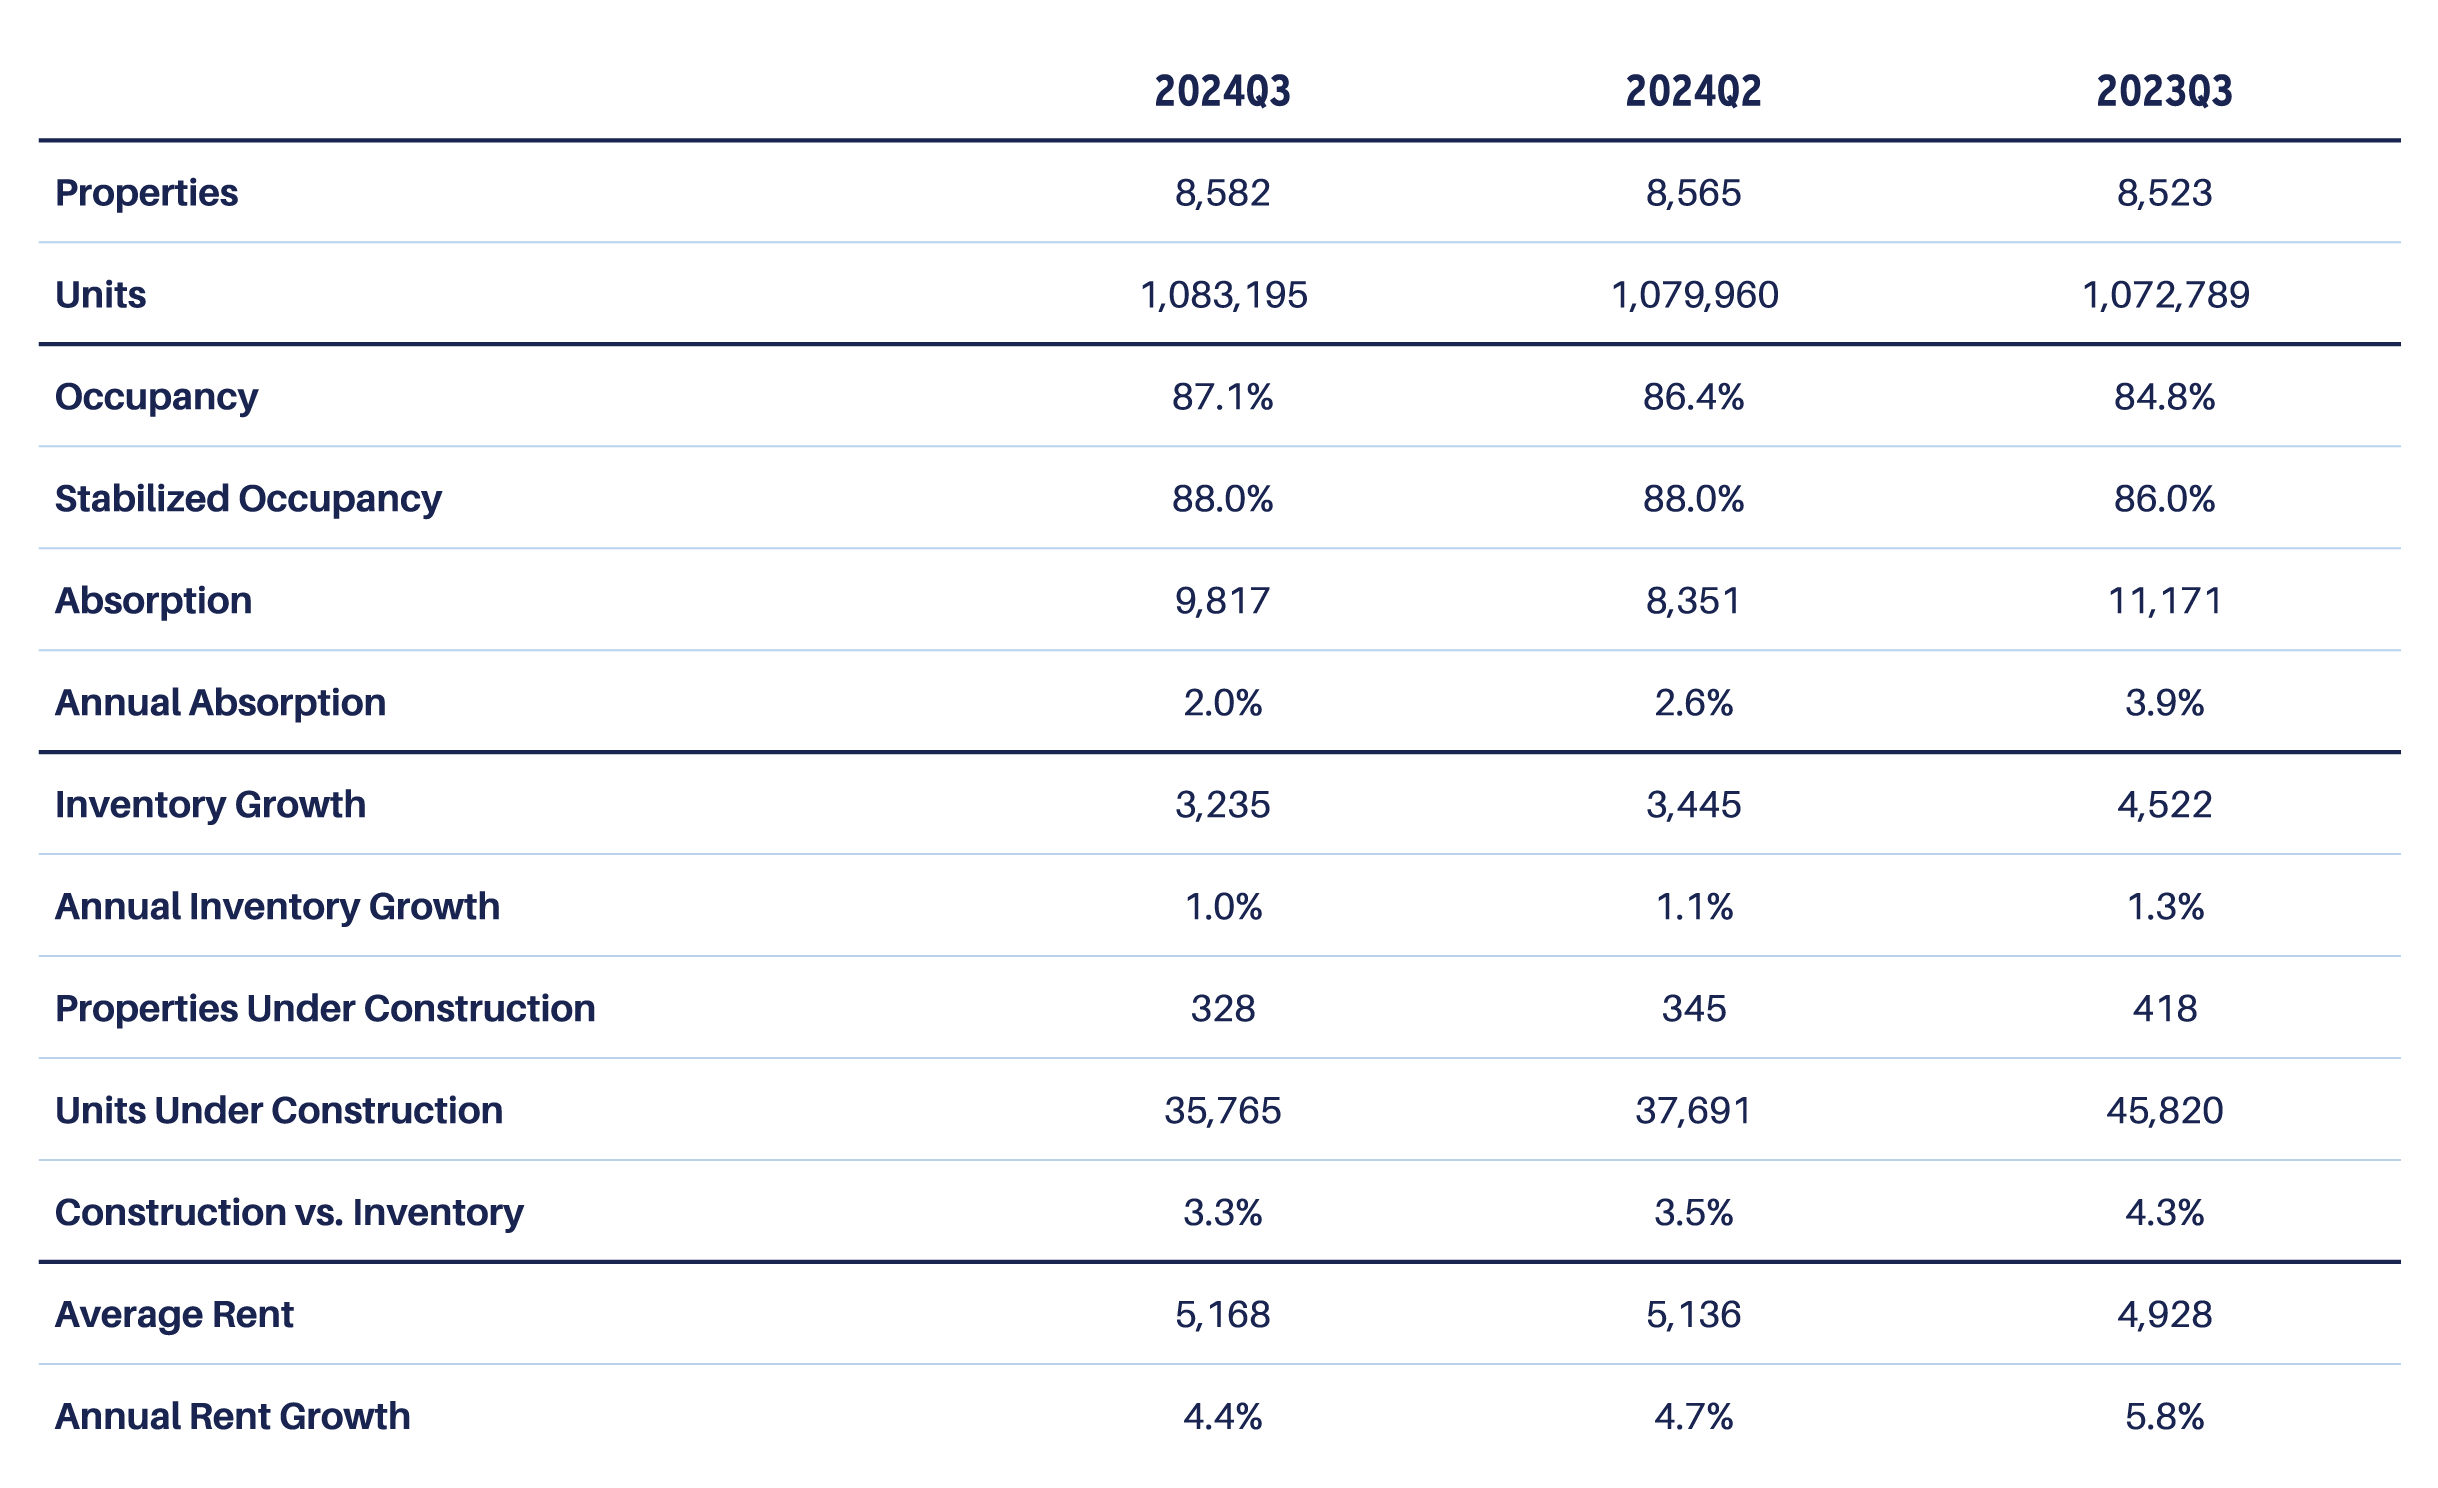
The sector turned in another strong quarter due to solid demand and modest inventory growth as the supply pipeline continued to unwind. Occupancies climbed 70 basis points (bps) in the third quarter, consistent with the pace increases over the past year and a half. Overall occupancy now stands at 87.1%, only 20 bps below the pre-pandemic high of 87.3% in the fourth quarter of 2019 across the primary and secondary markets tracked by the National Investment Center for Seniors Housing & Care (NIC). The median occupancy rate climbed to 90.6% with more than half of all assets reporting occupancy above the 90% threshold.
Demand was broad based by unit type, acuity level, geography and asset quality, albeit not uniform. While higher-acuity assets maintain a lower overall occupancy, majority assisted living assets reached 85.7% for the quarter, eclipsing pre-pandemic levels by 100 bps. Majority independent properties saw occupancies climb 50 bps to 88.4%. Overall, occupied inventory has expanded by approximately 8% since its pre-COVID peak, highlighting the secular strength in underlying demand. By unit type, memory care has materially outpaced the other segments on a percentage basis with occupied inventory up nearly 20% from its pre-COVID peak.
SENIORS HOUSING DEMAND GROWTH: PRIMARY AND SECONDARY MARKETS

Source: NIC Map Data Service
As of Q3 2024
SENIORS HOUSING FUNDAMENTALS TREND: PRIMARY AND SECONDARY MARKETS

Source: NIC Map Data Service
As of Q3 2024
SENIORS HOUSING MARKET FUNDAMENTALS: PRIMARY AND SECONDARY MARKETS

Source: NIC Map Data Service
As of Q3 2024
The story remains unchanged on the supply side with limited new projects breaking ground as development financing remains scarce and the relative return-on-cost to build versus buy remains unfavorable. While a select few projects have moved forward, developers appear to be slow to push forward with the expectation that capital will be more accommodating in the next 18-24 months as the recovery progresses and the demographic engine accelerates. The pace of new construction starts has fallen to roughly 11,100 units, or 1.0% of existing inventory representing the slowest pace since NIC has been tracking the sector. The total pipeline of units currently under construction has fallen to 3.3% of existing inventory (vs 7.4% at its peak in 2018) representing less than a year of demand, which is expanding at 3.7%, suggesting the occupancy expansion should remain solidly in place and support rents.
SENIORS HOUSING CONSTRUCTION STARTS (ROLLING 4-QUARTER, UNITS)

Source: NIC Map Data Service
As of Q3 2024
Rent growth has moderated somewhat from earlier in the recovery when inflationary pressures were at a peak, but operators continue to demonstrate an ability to pass through mid-to-high single-digit increases. Given the tighter leasing market, the ability to adjust rents (including care charges) has become more dynamic with operators better able to optimize revenue per occupied room (RevPOR). Through the Fall, rental and revenue increases are meeting or exceeding budgeted levels with pricing power remaining solidly in place. Operating expense pressures have also moderated as labor dynamics improve, helping to drive NOI growth well into the double digits, creating margin expansion. The use of contract labor and the ability to manage overtime has fallen more in line with pre-pandemic operating norms. That said, wage and cost pressures remain a likely governor on driving NOI and margins while top-line revenue demonstrates ongoing strength.
The capital markets and tight lending environment appear to be easing somewhat with signs of improving liquidity although risk tolerance levels remain quite wide. Most lenders have been supportive of refinancing their existing book of business where there is a path forward, but are now looking at selective new business. Traditional lenders are pivoting back into the market with Fannie and Freddie both actively quoting and banks also reemerging. The pullback from Basel III capital requirements in addition to improving operating metrics relative to other sectors are likely contributing factors. Spreads have come in although their remains a wide disparity on risk tolerances across lenders with a deeper pool for high-quality, stabilized assets. While there remains an aversion to higher risk (i.e. deep repositioning and development), debt funds' capital is becoming more readily available for value and pre-stabilized newer assets.
Transaction volume ticked higher in the third quarter to $1.8 billion. Activity through the first three quarters of the year is pacing about 10% ahead of last year, but remains well off normalized levels pre-pandemic. Pricing on a per-unit basis appears to have stabilized with cap rates also holding steady although there remains a wide disparity on an asset-by-asset basis which seems as much a reflection of asset/operator quality as overall market forces. While private and institutional capital have been active buyers, in aggregate they have been net sellers with listed REITs being the only net buyers through the first three quarters of 2024.
SENIORS HOUSING TRANSACTION VOLUME

Source: MSCI/RCA
As of Q3 2024
Overall, the third quarter saw a transition for the sector with values bottoming and the capital markets becoming more accommodating to new business. That said, the capital markets remain inefficient and challenging for anything outside of the highest-quality stabilized deals. The Federal Reserve’s action of initiating rate cuts was certainly a beneficial signal that extended beyond just the seniors housing sector although the long end of the yield curve moving notably above 4% may have a cooling influence. Operating fundaments have maintained their positive momentum supporting management’s ability to pass through higher rents, which is translating to outsized NOI growth and improving margins, a trend we expect to continue.
NET TRANSACTION VOLUME BY INVESTOR TYPE ($BILLIONS)

Source: MSCI/RCA
As of Q3 2024
For more information, please contact:
RICK BRACE, CFA®
Director, AEW Research
rick.brace@aew.com
617.261.9170
JAY STRUZZIERY, CFA®
Head of Investor Relations
jay.struzziery@aew.com
+1.617.261.9326
This material is intended for information purposes only and does not constitute investment advice or a recommendation. The information and opinions contained in the material have been compiled or arrived at based upon information obtained from sources believed to be reliable, but we do not guarantee its accuracy, completeness or fairness. Opinions expressed reflect prevailing market conditions and are subject to change. Neither this material, nor any of its contents, may be used for any purpose without the consent and knowledge of AEW. There is no assurance that any prediction, projection or forecast will be realized.

