TIME TO CATCH UP ON TRANSITION RISK TARGETS
How Does The Latest Data Affect Our Climate-Related Transition Risk Premium?
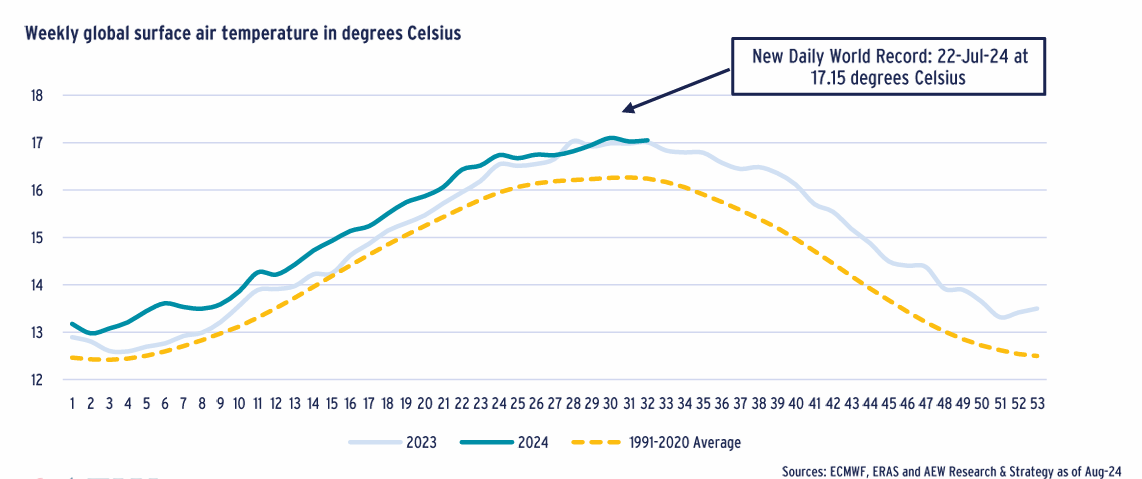
- News on climate change continues to concern. On two recent consecutive days -- 21 & 22 July 2024 -- the record high for global average temperature was broken, keeping climate change in focus. Politicians and voters across the world remain divided on the topic even as many have been making progress with meeting policy targets. At the same time, there is increased geopolitical tension with the ongoing war in Ukraine and conflict in the Middle East.
- These new temperature records could be due to 2023 droughts and wildfires triggering a reduction in global forests’ ability to act as an absorber of carbon emissions. Based on the preliminary research findings of the French Laboratory for Climate and Environmental Sciences, the growth rate of CO₂ in the atmosphere shot up in 2023 by 86% compared to 2022. Yet CO₂ emissions only increased by between 0.1% and 1.1%. The study’s explanation is that natural carbon sinks (like forests) absorbed much less in 2023. If this reduced ability becomes more regular in future, established decarbonization targets might need to be both drastically raised and sped up.
- Climate-related transition risk includes the long term anticipated regulatory requirements focused on energy use and CO2 reductions, which can result in assets becoming stranded if insufficient decarbonization action is taken. Our analysis remains based on version 2.03 of the Carbon Risk Real Estate Monitor (CRREM) - the de facto Paris Accord-aligned industry standard for climate-related transition risk.
- In our fifth report, we focus on the impact of climate-related transition risks only, by quantifying the impact on European prime commercial real estate returns. Our Sep-23 report left us with a number of questions, some of which we are now able to address.
- What if current levels of energy intensity are inconsistent with pathways’ starting point?
- How much more energy reduction is needed to offset the embodied carbon of the pathway-required retrofits themselves?
- Where could the actual retrofit capex costs be higher from those assumed by the CRREM pathways?
- New data from CRREM, CFP Green Buildings (CFP) and the Buildings Performance Institute Europe (BPIE) allow us to answer these questions. As a result, we adjust our original five step approach by (1) Using country and sector specific starting points for the pathway reduction in terms of current kWh/m2/pa (2) including the embodied carbon related to required retrofits to meet the pathway; and (3) considering an adjustment to our existing methodology for country- and sector-specific costs of the retrofit capex.
- Our aim is to provide an update of the existing climate transition risk premiums (excluding the physical hazards) for each of our sector and city-specific segments, which has been part of our Relative Value Approach for the last few years.
European Real Estate Decarbonisation Costs Increase but Remain Achievable
- In this report, we provide our updated estimate of the impact of climate-related transition risks, after incorporating the answers to three outstanding questions raised in last year’s report, while leaving the physical climate risks out of our analyses this time.
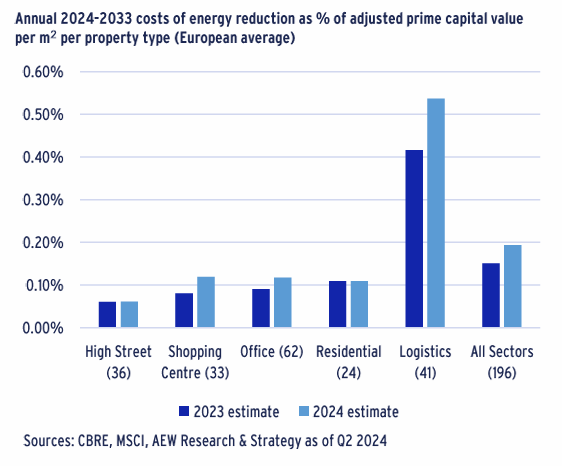
- At 19 basis points (bps) pa, our updated average climate transition risk premium across our 196 European market segments covering 20 countries and five property types is up near 30% vs last year’s estimate of 15bps. As before, this risk premium reflects how much investors should be compensated for this specific market risk.
- Given the AEW projected annual return of 8.8% for the 2024-28 period across all European prime sectors, our 19 bps of annual required capex to meet the decarbonisation targets should be achievable for investors.
- There are significant differences per sector from the all-sector average required retrofit of EUR 14 per sqm per annum. Shopping center and logistics are at EUR 18 and 17 per sqm per annum, while residential is lowest at EUR 10 per sqm per annum.
- Similarly, the estimated all-sector 19 bps of extra annual required capex also shows significant difference between sectors. In that respect, the European logistics market comes out highest at 54 bps mostly due to the relatively lower prime capital value per sqm. Paris is higher than average because logistics capital values in the Paris region are not as high as in Germany and the Netherlands.
- The required investment in retrofits is estimated at EUR 14 per sqm per annum based on CRREM and it is unlikely to be different between prime and non-prime located assets. As they have lower capital values, non-prime assets are estimated to need an average of 36 bps of energy intensity reducing capex, almost double the 19 bps for prime assets. However, higher non-prime returns should still allow these capex costs to be achievable for most investors.
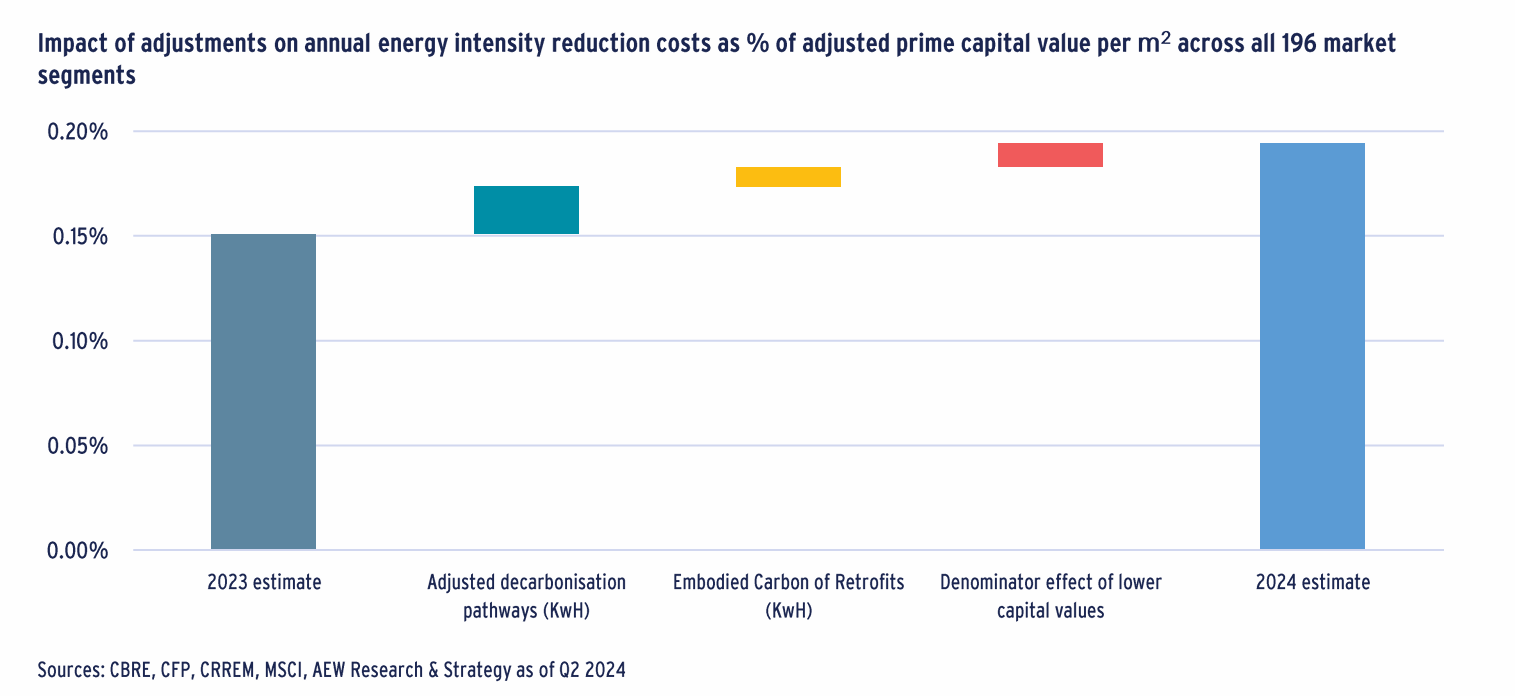
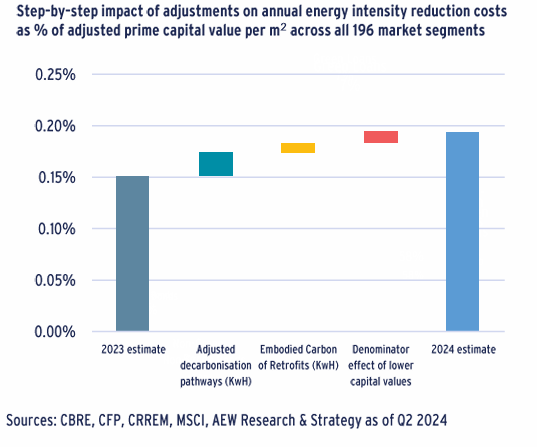
- As can be seen in our step-by-step chart below, the increase from 15bps last year to 19bps this year comes from a number of factors, including (1) a 2bps impact from the higher energy intensity (kWh/m2/pa) starting point; (2) a 0.9bps impact from embodied carbon of retrofits and (3) 1.1bps comes from the lower (adjusted) prime capital values erode the denominator and push up the bps impact.
- (1) Across our 196 segments, 147 markets are “over-budget”, i.e. where the 2023 estimated energy use is ahead of that assumed by CRREM, while for 49 markets the actual is “below budget”. The average difference between the actual starting point and the assumed CRREM pathway is estimated at 31% across all segments. Shopping centres and logistics have the most ground to make up.
- (2) To meet the CRREM pathways, specific retrofits that reduce operational energy intensity such as insulation, heat pumps, lighting, window & roof replacements are needed. Embodied carbon related to the materials and fitting works needed to put these in place are estimated at 67 kg CO2/sqm, with offices most impacted. These should be offset on top of the original pathways and add about 2% to the starting point.
- (3) Capital values declined by 9% since last year, as a result of interest rate increases, which have been integrated in the analysis. Since the cost of the required retrofits is measured as a percentage of capital values, this contributes to an increase in the climate transition risk premium (+1.1bps). An expected continued decline in interest rates should help reverse this impact going forward.
How much behind schedule is industry to meet the future targets?
- In our Sep-23 report titled Real Estate’s Climate Risk Premium we highlighted that actual energy intensity was higher than the estimated CRREM’s 2022 energy intensity starting point.
- Our latest analysis confirms the starting point remains a problem.
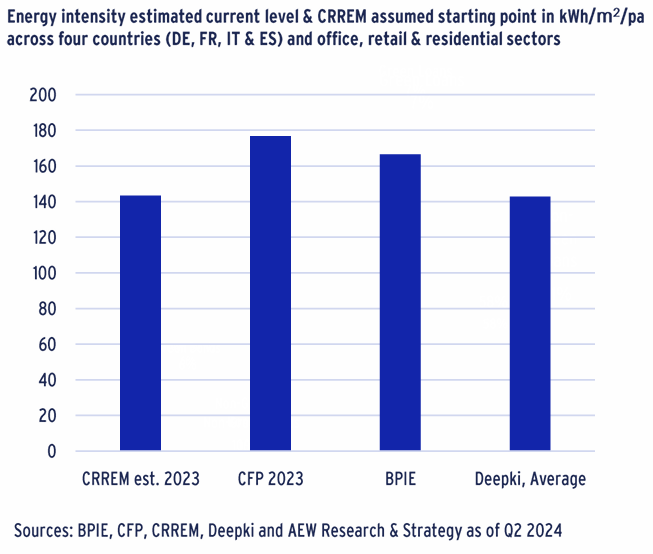
- AEW estimates 2023 intensity of 144 kWh/m2/pa based on CRREM.
- This is 23% lower than estimated by CFP at 177 kWh/m2/pa and 17% lower than AEW’s estimate of 167 kWh/m2/pa based on the BPIE inputs reflective of their country and sector specific data. Both estimates reflect a consistent sample of segments and buildings.
- Deepki’s estimate is 143 kWh/m2/pa. All four estimates based on final energy use at the building without tenant specific use adjustments.
- In short, two independent sources confirm a significant discrepancy between the 2023 starting point and the current energy intensity.
- Based on this, it appears that the industry is already about 20% behind schedule on our energy reduction pathway – using more than our allocated cumulative carbon budget until 2050.
- Since the industry is behind schedule, it might need to move faster and make up for its past over-budget carbon usage by 2050.
What is needed to offset the embodied carbon of retrofits?
- To meet the CRREM pathways, specific retrofit projects such as building management system upgrades, insulation, heat pumps, lighting, window & roof replacements are needed.
- Embodied carbon related to the materials and fitting works needed to put these in place should be offset on top of the original pathways.
- In Sep-23 report titled Embodied Carbon of Retrofits, CRREM collected data on 36 different retrofit projects with an estimated maximum embodied carbon of 140 kg CO2/m2.
- This compares to the range of 600-750kg CO2/m2 of embodied carbon for new buildings, referenced in the same report.
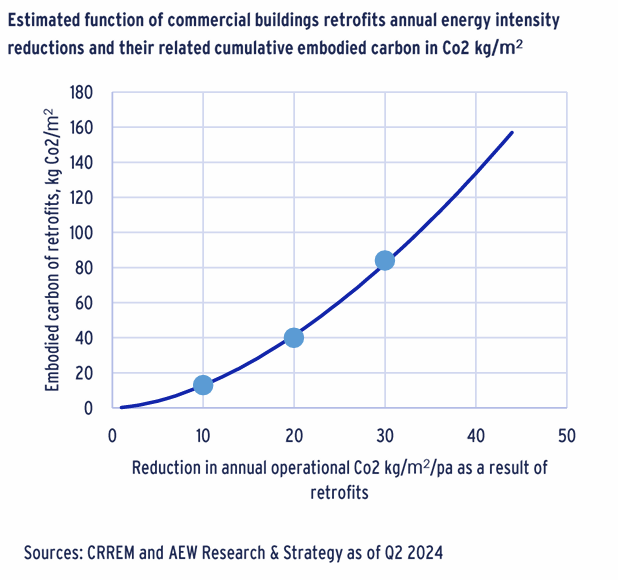
- Based on this, we assume for a deep retrofit, average annual savings of 30 kg CO2/m2 would trigger cumulative embodied carbon of 84 kg in CO2/m2. For a medium or light retrofit this is assumed at 20 or 10 kg annual savings and 40 or 13 kg of embodied carbon.
- Next, we build a function shown in the graph with the annual operational reduction of CO2 as a result of the retrofits and the cumulative embodied carbon created at each level of retrofit.
Where Do We Expect Higher Than Planned Retrofit Costs?
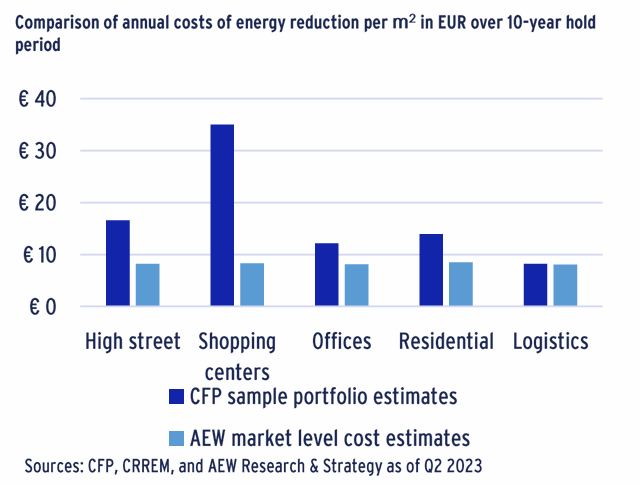
- In our own Sep-23 report titled Real Estate’s Climate Risk Premium we compared our own CRREM-based estimates with the CFP costs based on a portfolio of 513 buildings.
- The average cost of required retrofits for this portfolio came out at more than double our own EUR 8/m2/pa CRREM-based estimate.
- These discrepancies are likely due to non-prime properties within the sample portfolios, as well as in the discrete nature of improvements required, e.g. roof, window replacements or insulation.
- However, this year’s expanded sample portfolio results could confirm whether the retrofit costs are in fact higher than implied by our original CRREM-based costs per m2/pa.
- In other words, the industry might not only need to speed up its efforts to reduce its buildings’ energy intensity – but it might also cost more to do so than originally budgeted.
Refined Energy Reduction Costs Based On Updated Five Steps
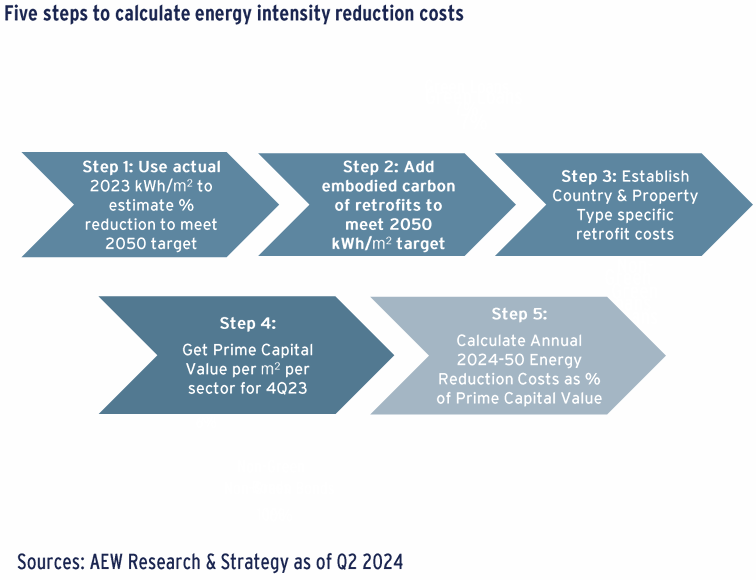
To address the three questions above, we have updated our five-step approach to estimate the market-level energy intensity reduction costs, which we will explain further below:
- Use the actual 2023 energy intensity in kWh/m2/pa to look up the % energy intensity reduction needed from CRREM tool for each country’s five sectors (residential, high-street retail, shopping centres, offices and logistics);
- Add the required kWh/m2/pa reduction needed to offset the embodied carbon of the pathway-required retrofits;
- Calculate the annual retrofit costs per m2 to meet the 2050 target, testing CRREM’s modelled costs assumptions by considering alternative data from CFP;
- Determine prime capital values as of year-end 2023 for each city-property type segment ;
- Calculate the annual energy intensity reduction costs to meet the Paris Accord-based pathways as a % of prime capital value for each of our 196 city-sector segments.
Step 1: Higher current energy use requires steeper pathway
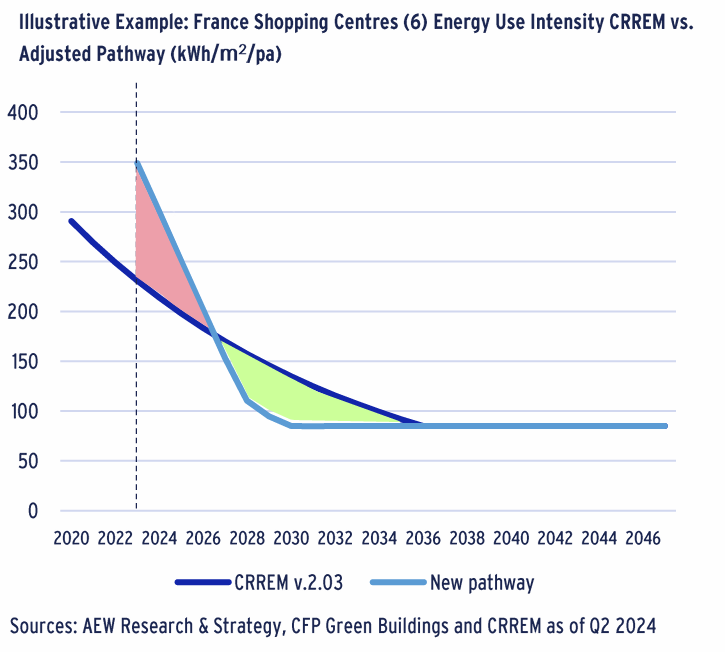
- As highlighted above, actual energy use for most sectors is above the estimated CRREM 2023 starting point. As an extreme example we use French shopping centres to illustrate the challenge this poses.
- Estimated energy use based on our CFP representative French shopping centres implies 2023 energy use of 350 kWh/m2/pa, which is nearly 50% above the 231 kWh/m2/pa CRREM starting point.
- Since the (area under the) pathway represents the cumulative carbon budget for this sector, the red-shaded “over-budget” area cannot be fully corrected only by returning to the pathway.
- To make up for the “over-budget” period use we need a much steeper pathway to offset this deficit and arrive at the target CRREM pathway level already by 2030 as shown in the green-shaded area.
- To have a consistent quantification for each of our 196 market segments we calculate a revised pathway correcting for each using its own CFP representative starting point.
- It seems plausible that if these more challenging energy reductions cannot be achieved going forward in the European policy context that a carbon tax might be introduced to incentivise industry.
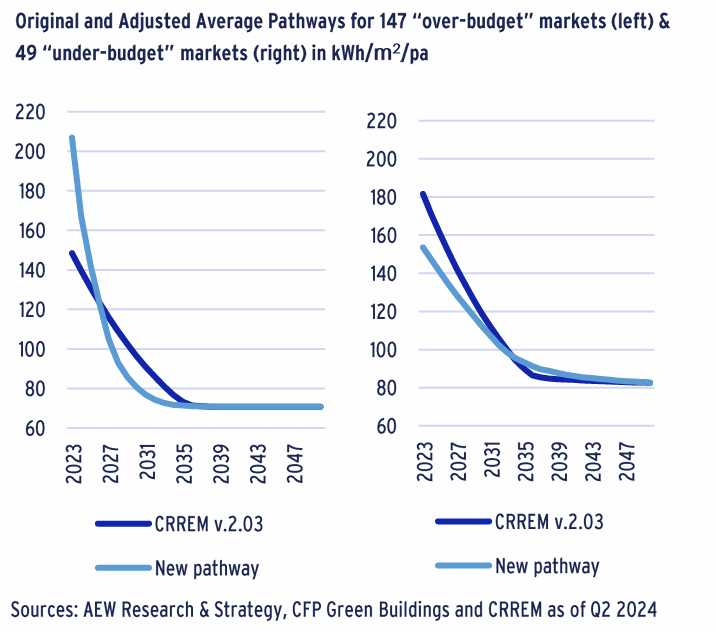
75% of European Markets Might Need Steeper Pathways
- Across our 196 segments, 147 markets are “over-budget”, i.e. where the 2023 energy use is ahead of that assumed by CRREM, while for 49 markets the actual is below its assumed CRREM energy intensity.
- Note that depending on the markets included, the average CRREM pathway differs. In the case of the 147 “over-budget” markets, the average CRREM pathway is lower and more challenging.
- For the 49 “under-budget” markets, the original CRREM pathway is higher to begin and end with than for the “over-budget” markets.
Please note that these differences in average pathways are consistent with the CRREM tool and based on the current and assumed future carbon intensity of each country’s energy system. - Our assumed 2023 energy intensity is based on CFP estimates of building level energy use for a sample of nearly 900 buildings based on each building’s use, size, age and other basic data.
- In future, we hope to have better actual industry-wide energy use across markets. For now, the best available data is used to show the potential impact of being over or under-budget.
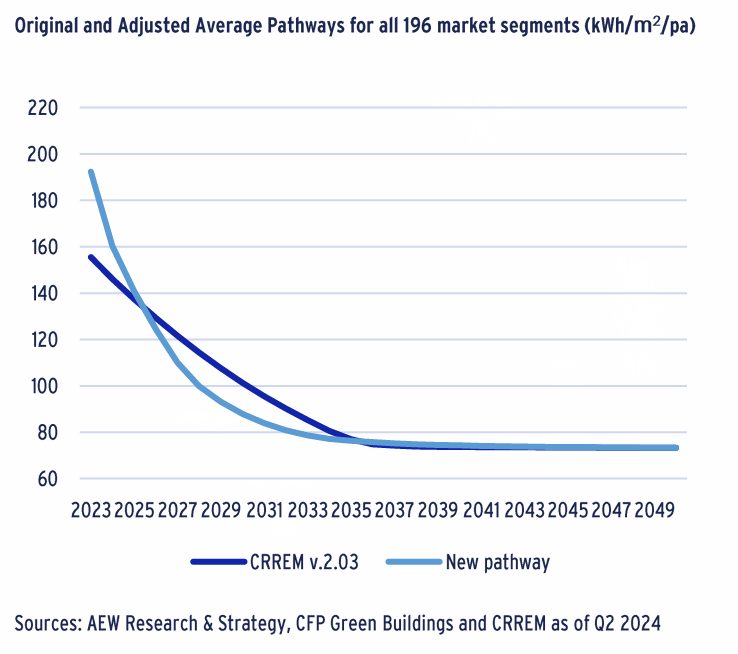
European Markets Might Need Steeper Decarbonisation Pathways
- When we take into account both our 147 “over-budget” and 49 “under-budget” markets the average actual energy use is 192 kWh/m2/pa well above CRREM’s 156 kWh/m2/pa assumed level.
- This 23% higher net starting point across the European average pathway requires a similar (albeit less) pathway adjustment as shown for our French shopping centres.
- Since the (area under the) pathway represents the cumulative carbon budgets for all sectors, the current “over-budget” status cannot be corrected only by returning to the original pathway.
- To make up for the collective “over-budget” period energy use, we need a much steeper pathway to offset this deficit and arrive at the required CRREM pathway level by 2036.
- As illustrated above, we can make these pathway adjustments for each of the 196 European markets we cover across 20 different countries and five property types.
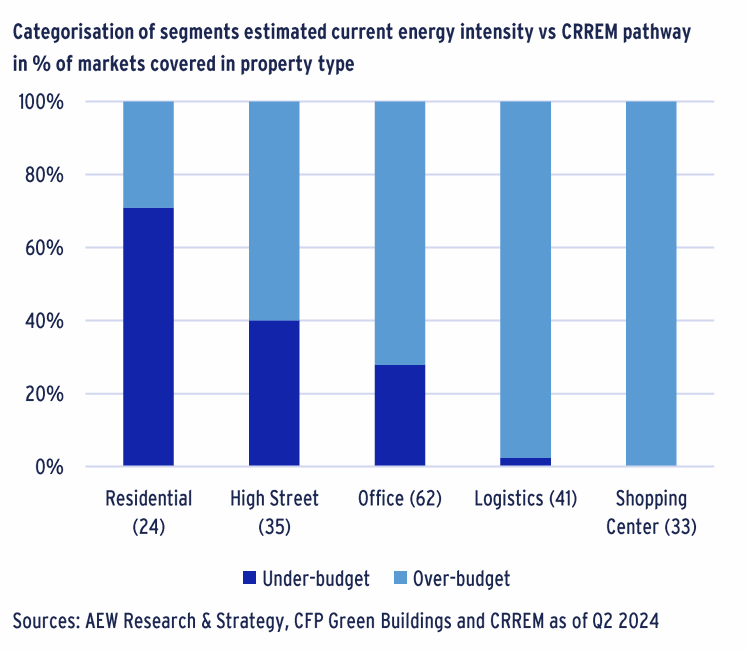
Shopping Centres & Logistics Have Most to Catch Up
- When we categorise our markets by their energy intensity status across property types, both shopping centres and logistics have more ground to make up – relative to the CRREM pathway.
- This can be explained by a number of factors. In the case of most shopping centres, their high energy intensity is due to their size and need for heating and/or cooling given they are open to the public.
- This might not (yet) be fully reflected in our CRREM-based estimate.
- In the case of logistics buildings, energy efficiency will depend on the tenants’ need for heating and lighting. Note that we do not use the cooled storage pathway option available in CRREM.
- The result for residential was better than expected, as more markets are ahead of their pathways. This could be due to higher energy pricing and residents controlling actual use in their own units.
- Also, there could be some bias in our market-representative residential building sample having more efficient units compared to the residential building stock as a whole and other sectors.
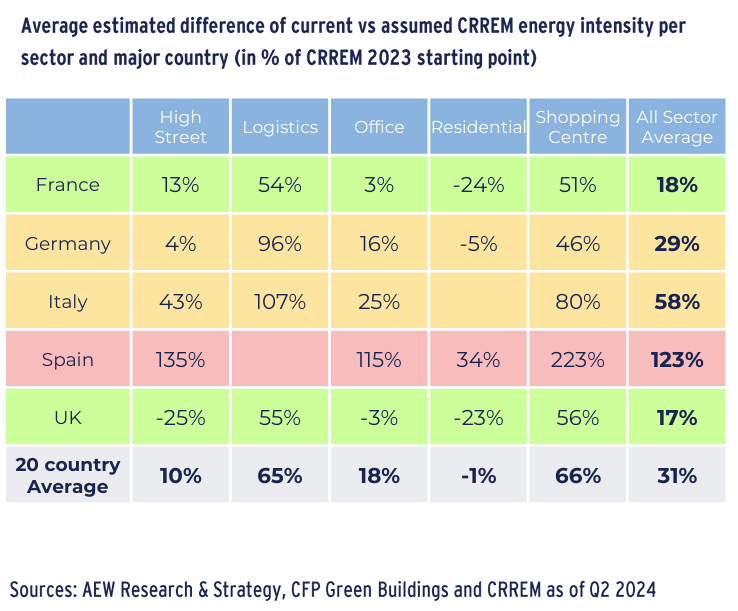
Step 1: UK & France Ahead of European Average
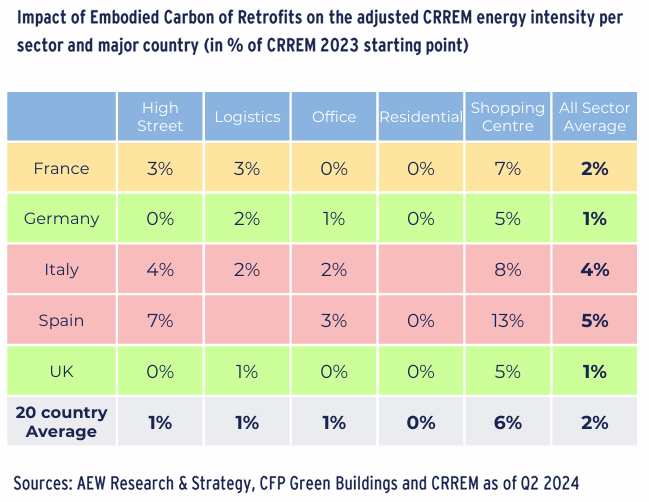
- Since sector averages hide differences between countries, we provide a table showing the average difference of current vs assumed CRREM energy intensity per sector and selected countries.
- This table shows the average difference between starting point and assumed CRREM pathway at 31% across each of the 196 segments.
- Our table confirms that shopping centres and logistics have the most ground to make up, while residential markets are mostly on track.
- More data and research might bring outliers like Spain and Italy in line with the other key European markets.
- Across countries, Spain and Italy stand out as showing very high over-budget estimates. The need for air conditioning in the hotter Spanish and Italian weather might play a role.
- The UK and France are ahead of the European average, but still require steeper pathways in two and four sectors, respectively. This is likely due to their already lower and more challenging pathways.
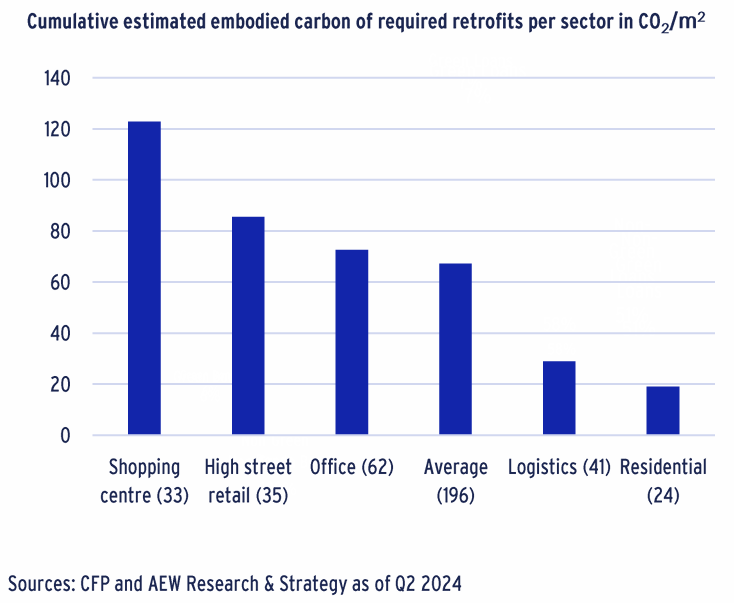
Step 2: Incorporate Embodied Carbon Of Needed Retrofits
Embodied Carbon For Retrofits Estimated At 67 Kg CO2/M2
- Next, we address the embodied carbon of the retrofits. This requires us to translate the absolute carbon of these retrofits into the operational energy intensity reductions needed to offset them.
- Given our market level perspective, we stay away from asset-level earn-back periods to determine the feasibility of specific retrofits.
- CFP estimates for each building the specific retrofit required to meet the pathway as well as the CO2 and kWh saved over the period.
- This allow us to use the utility function already specified and explained on page 3 to approximate the embodied carbon of the required retrofits for each of the 964 buildings in our sample
- In the chart, we show that across the sample we estimate 67 kg of embodied carbon (CO2) per square meter as an average across all the 196 property market segments.
- Again, the embodied carbon for shopping centres is well above this all-sector average, while residential and industrial assets show a below average amount of embodied carbon.
CRREM Pathways are Basis for our Estimated Conversion Factor
- After estimating the cumulative embodied carbon of the retrofits, we need a way to translate the cumulative CO2 emissions into kWh/m2/pa. We do this based on our estimated conversion factor.
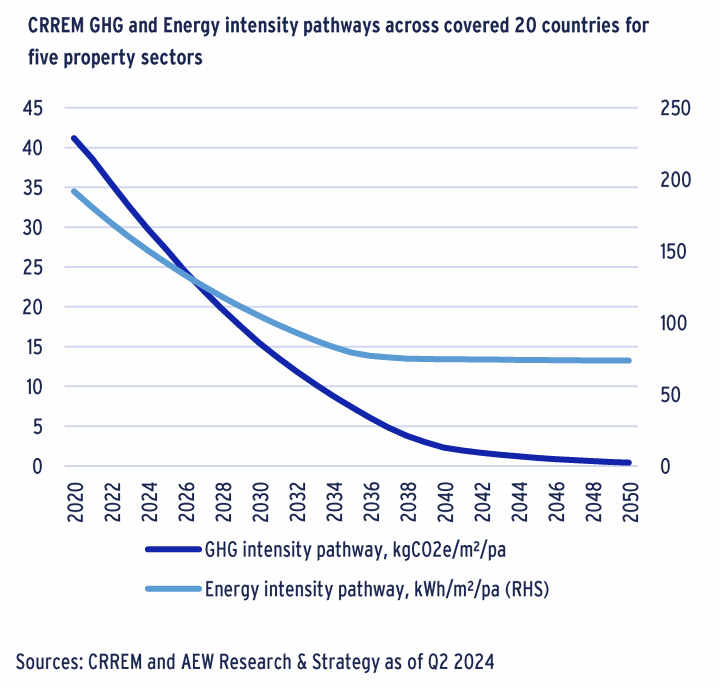
- The basis for calculating our conversion factor is the original Paris accord-aligned CRREM CO2 and kWh pathways -- where it all began.
- The key assumption is that the CRREM pathways show that even as CO2 needs to come down to zero to meet the Paris Accord target, kWh does NOT need to be reduced to zero.
- This is due to the assumed future decarbonisation of the energy grid, which is well under way across Europe, despite significant differences across countries.
- This leaves the required operational energy intensity reduction also with a realistic target, as it is unlikely buildings will not use energy.
- Our methodology has significant assumptions, including that embodied carbon of retrofits is not purely operational. It could be allocated to another part of the carbon budget, such as construction.
- However, we have assumed that most responsible investors would want to include it in their capex and asset management budgeting.
Factor Transforms Embodied CO2 into Needed KWH Reduction
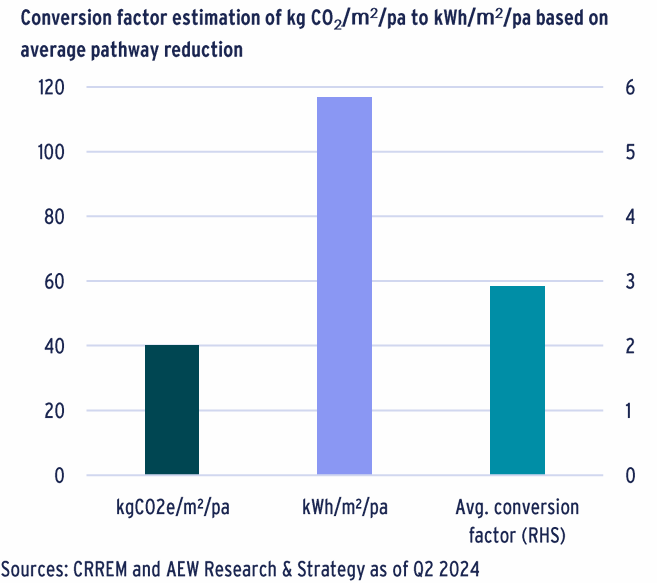
- The above pathways show that across our 196 covered markets across 20 countries and five property sectors we need to decarbonise from 40 kg CO2/m2/pa to zero.
- At the same time, CRREM also provides an equivalent average reduction of 117 kWh/m2/pa from 191 kWh/m2/pa to 74 kWh/m2/pa.
- This means that for each kg CO2/m2/pa a reduction of 2.9 kWh/m2/pa is needed (= 117/40) across our European markets.
- On average, we apply this 2.9 conversion factor to convert the embodied carbon of retrofits in kg CO2/m2 into the kWh/m2/pa -equivalent in energy intensity reduction.
- This higher-level conversion factor was arrived at after detailed input from the CRREM team.* It disregards different mix of energy savings for deep retrofits (such as roof and façade replacements) are likely to reduce gas use while lighter retrofits are likely to show a more immediate lower electricity use savings.
Impact on Adjusted Pathway from Embodied Carbon
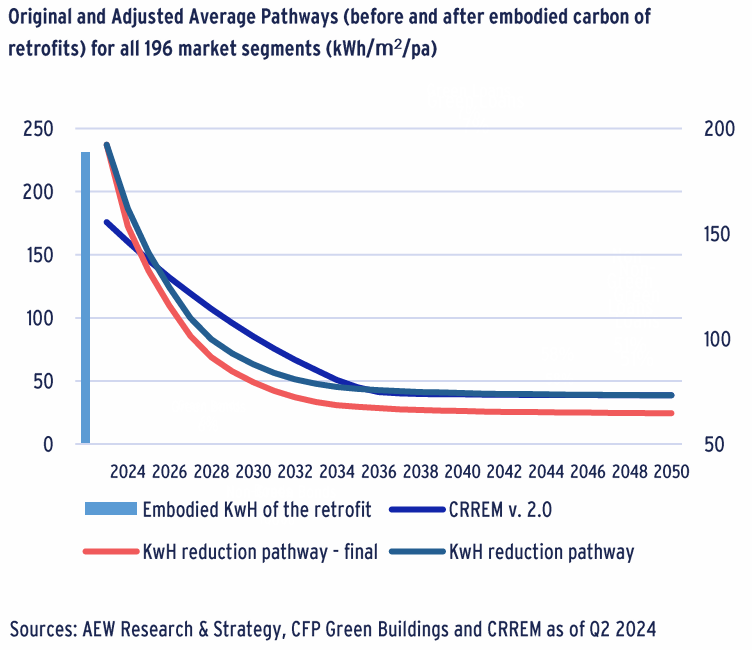
- Given the sector average embodied carbon of 67 kg/CO2/m2 and the average conversion factor of 2.9 we would expect a cumulative kWh impact of the retrofits at about 195 kWh/m2.
- However, given that our 196-segment universe is overweighted towards the above sector average retail & office segments, we have an estimated off-set for the overall embodied carbon of 230 kWh/m2.
- When we apply this additional required offset to our previous adjusted pathway (from our higher starting point), we can visualise the impact from the embodied carbon of the associated retrofits.
- Instead of an even higher starting point, we assume the average 230 kWh/m2 of embodied carbon to be offset by an additional annual reduction of 8.5 kWh/m2/pa for each year in the 2024-50 period.
- As before, we make these pathway adjustments for each of the 196 European markets in 20 different countries and five property types.
- To accommodate for the steeper pathways, additional efforts of energy intensity reduction are needed for most European markets.
Again, the results for individual market segments can vary significantly depending on the degree of the required retrofits and current deviation from the CRREM pathways.
Embodied Carbon Impacts on Offices Most
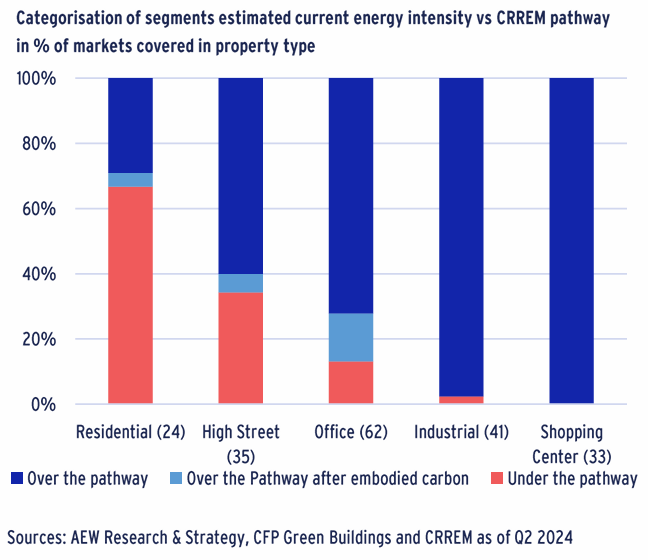
- After quantifying the impact of the embodied carbon of the required retrofits, we can update our markets’ categorisation by their energy intensity status across property types.
- Shopping centres and logistics remain in the same position, having most ground to make up – relative to the original CRREM pathway.
- In the case of offices, high street retail and residential, additional markets were pushed into being “over-budget” due to the embodied carbon of the retrofits.
- The effect of embodied carbon was most significant for offices, categorising another 9 of 62 markets into being “over-budget” and higher than the required pathway.
- Again, sector averages hide differences between countries and therefore we also provide an updated version of the sector and country specific difference table.
Step 2: Cumulative Impact of Embodied Carbon Remains Limited
- Since sector averages hide differences between countries, we provide a table showing the average impact of embodied carbon on our adjusted energy intensity reducing retrofits.
- This table shows that the average impact of embodied carbon is to bring the kWh/m2/pa starting point down by an additional 2%.
- Shopping centres and logistics remain in the position of having most ground to make up, while residential markets are still mostly on track.
- Even though no shopping centre markets shifts in our categorisation, the impact from embodied carbon of retrofits is actually most significant with a 6% impact – up from 66% to 72%.
- Across countries, Spain and Italy are impacted most by the additional impact of the embodied carbon of retrofits, with increases of 5% and 4%, respectively.
Steps 3 & 4 – Updated Costs of the Retrofits And Capital Values
New Data Confirms No Need to Adjust Retrofit Costs Methodology
- Our Sep-23 report of the previous CFP sample portfolio showed that the average cost of required retrofits came out at more than double our own EUR 8/m2/pa CRREM-based estimate.
- However, we assumed a reduction in future cost of retrofits (consistent with CRREM), while CFP costs were in current prices.
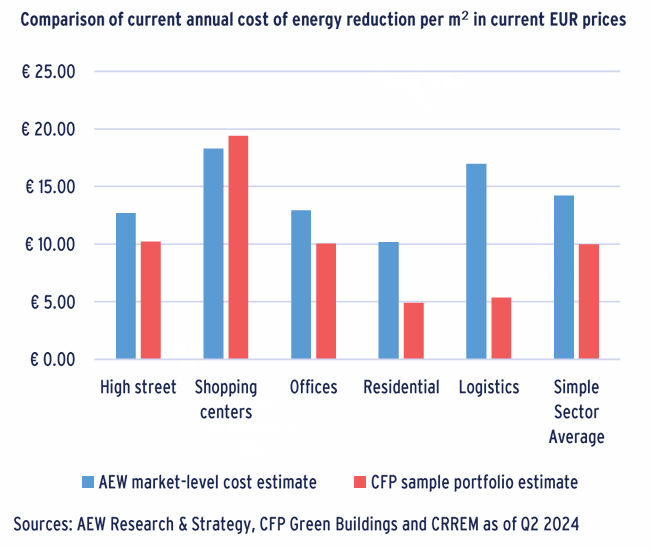
- This time we repeat the comparison of the new CFP portfolio of 964 buildings with our market-level estimates – both in current prices.
- The average cost of retrofits estimated by CFP stands at EUR 10/m2/pa, well below our estimate of EUR 14/m2/pa based on CRREM, with highest discrepancy in logistics and residential sectors.
- This reversed result gives us reassurance that our original methodology of estimating retrofit costs remains appropriate.
- This assumes that the costs are decreasing in the future and are adjusted by city, based on the Arcadis city-level index -- as more fully described in last year’s report.
- As time progresses, future retrofit costs can be better estimated as reductions in actual costs are better recorded.
STEP 3: Despite Higher Required Reduction, Same Cost Approach
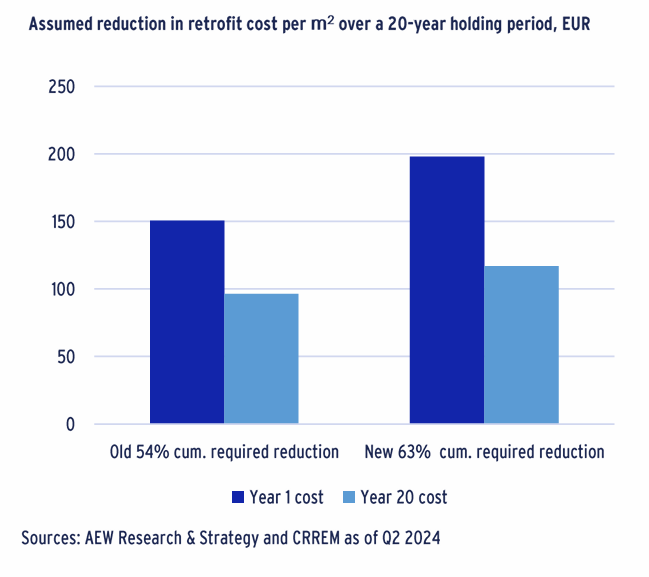
- One of CRREM’s central assumptions is that the costs for the required retrofits are higher per m2 for deeper retrofits – where the required cumulative energy intensity reduction is higher.
- Annual costs are also assumed to reduce in future, as technological advances, economies of scale and production efficiencies kick in as more investors implement retrofits.
- Costs for deeper (and more expensive) retrofits are assumed to come down more in future. So, how does this impact our analysis?
- Due to the higher estimated starting points from step 1 and the embodied carbon in step 2, we estimate that across our 196 markets we need to achieve a 63% cumulative energy intensity reduction.
- This is an increase from last year’s estimate of 54% over the assumed 20 year holding period.
- It should be noted that the associated increase costs are a reflection of step 1 and 2 and not an increase in the nominal costs of the retrofits themselves.
Step 4: Adjusted Prime Capital Values Denominator Comes Down
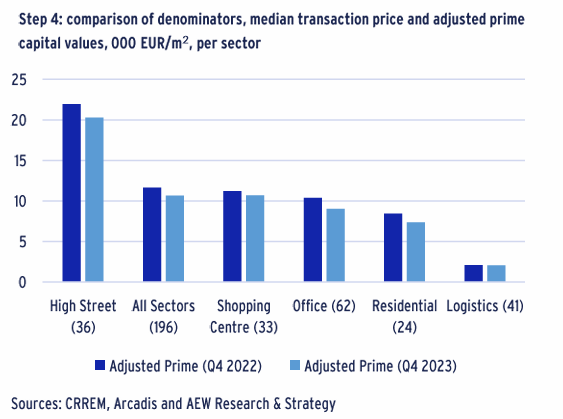
- In our next, fourth step, we update each segment’s adjusted prime capital value based on the reported change in CBRE prime capital values in 2023.
- This is done to ensure consistency with the other risk premia in our relative value approach which compares the prime expected return with a risk-adjusted required rate of return for each segment.
- Last year’s capital values for both high street retail and shopping centre markets were calculated as 3.0 times the median price while other sectors’ prime capital values remained unadjusted.
- Based on this, our cross-sector (adjusted) prime capital value declined by over 9% between year-end 2022 of EUR 11,700 per m2 to EUR 10,700 per m2 as of year-end 2023.
- This reduction in the denominator should be expected to have an increasing impact on the retrofit costs as a % of the capital value.
- Logistics is the only sector where the average prime values did not show a significant decline between the two points in time.
STEP 5: Transition Risk Premium Estimated at 19bps Per Annum
- The magnitude of the European cross-sector average transition risk premium is estimated at 19bps. As discussed above, our changes compared to last year are explained by:
- Step 1: Adjusting the decarbonization pathway based on the over- or under-budget current energy use vs the pathway
- Step 2: Embodied carbon of needed retrofits
- Step 3: Confirmation of our retrofit costs (no change)
- Step 4: Updating our (adjusted) prime capital values.
- As can be seen in our step-by-step chart, the impact from step 1 across our covered markets is most significant at 2bps pa.
- The second largest impact of 1.1bps comes from step 4, where the lower (adjusted) prime capital values erode the denominator.
- Thirdly, there is a 0.9bps impact from embodied carbon of retrofits.
- Finally, we keep the same method of estimating annual retrofit costs.
Despite 30% Increase, Transition Risk Remains Modest
- As before, our estimate for the required annual energy intensity reduction costs is specified per city-sector segment as a percentage of (adjusted) prime capital values.
- This can be defined as an annual climate transition risk premium which investors should require to be compensated for the needed annual energy intensity reducing retrofits.
- The magnitude of the European cross-sector average transition risk premium is estimated at 19bps. This is a near 30% increase compared to our 15bps estimate from last year.
- Similar to our Sep-23 results, we show that the logistics sector has the highest climate transition risk premium, mostly due to the relatively lower prime capital value per m2 of logistics.
- Despite updating our five-step approach, high street retail and residential’s risk premiums remained unchanged, on average.
- Shopping centre and office markets showed 4bps and 3bps increases, which reflect 44% and 40% increases, respectively.
Results Show Maximum Transition Premium of 98bps
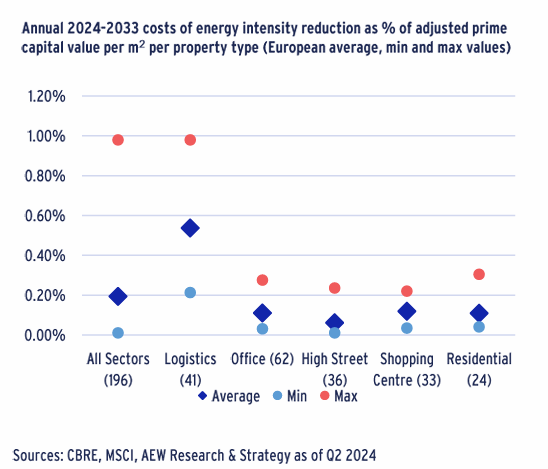
- To further illustrate the cost variation across markets, we show the minimum and maximum value for all 196 segments.
- Annual costs for retrofit capex range from 1bps for the lowest retail and residential sectors to as much as 98bps for the highest logistics market (Lille).
- The largest variation in the costs across sectors is in the logistics sector, where the difference between the highest and lowest costs in the sector for covered markets is about 80bps.
- In other sectors the variation is significantly lower, with an average value of 23bps between the highest and lowest cost.
- The average difference between the highest and lowest sectors within the same city stand at 28bps.
- Property sector maximums across Europe stand at 23bps for Budapest high street retail, Bordeaux offices with 28bps, Malmo residential with 30bps, and Bristol shopping centres with 22bps.
STEP 5 – climate-related transition risk premium estimates in more detail
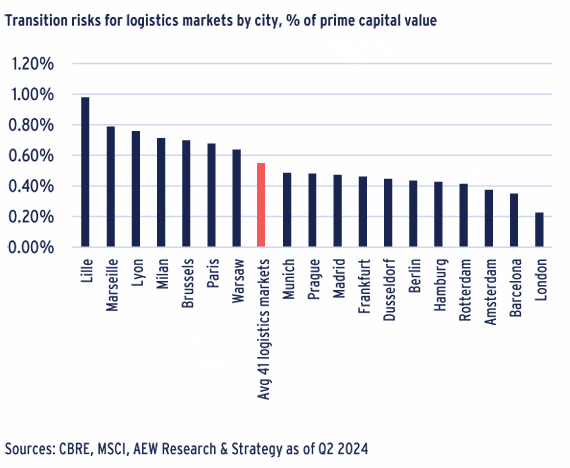
Transition risks for Logistics at 54bps on Average
- The logistics sector has the highest climate transition risk premium, mostly due to the relatively lower prime capital value per m2 of logistics.
- The 41 cities average, which stands at 54bps includes smaller logistics markets where capital values per m² are low.
- On city level, Lille stands out with the 98bps, higher than the other French regional office markets.
- Paris has a higher-than-average transition risk premium because logistics capital values in the Paris region are not as high as in Germany and the Netherlands.
- This is also the case of Milan logistics, in contrast to Milan offices (see below).
- By contrast, London stands out with the lowest risk premium as the market has the higher capital value per m² in Europe.
- The CEE markets, Warsaw and Prague, are performing in line with the average.
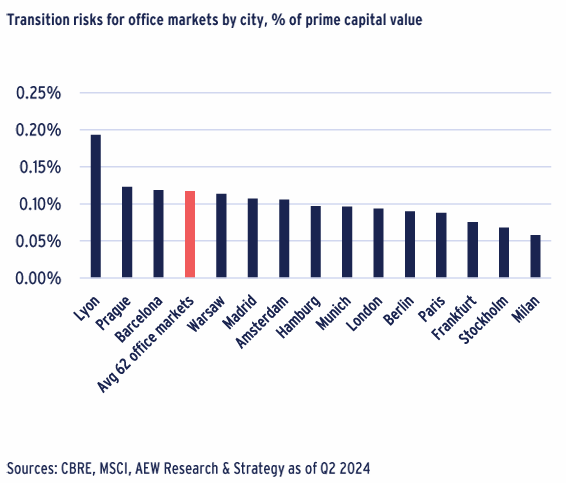
Transition Risks for Offices at 12bps on Average
- The office sector has a climate transition risk premium of 12 bps, on average across the 62 office markets covered.
- The 62 cities average, which stands at 12 bps, appears high in comparison to the markets represented on the chart, as the average includes smaller regional office markets where capital values per m² are low.
- The transition risk premia for offices range from 3 bps in Zurich and Geneva where capital value per m² is high to 27 bps for the French regional markets when capital values per m² are low.
- The transition risk premium of London and Paris is estimated at 9 bps due to their high prime capital values.
- The German markets are below the all-cities average.
- Lyon stands out on the chart with a relatively high transition risk premium, despite having similar capital value per m² than the following two markets (capital value per m² currently stand at €5,900/m² in Lyon, compared to €6,200/sqm in Prague and €6,960/m² in Barcelona).
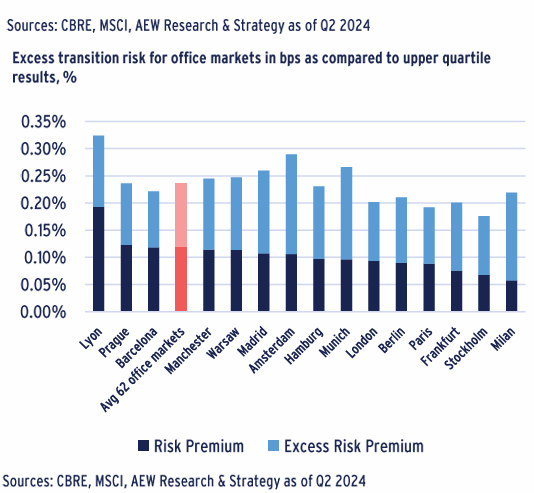
24bps Transition Risks for Non-Prime Offices Double Prime
- Since the cost of the energy reducing retrofits is unlikely to be different between prime and non-prime assets, non-prime assets suffer from lower capital values increasing the basis points impact.
- Similar to last year, we use a non-prime capital value adjustment factor for each individual segment (sector and city). This has been applied to our updated year-end 2023 prime capital values.
- Compared to the 12bps average for all prime office markets, we show an average of 24bps of capex for non-prime office markets required to meet climate related risks.
- For some markets the impact on non-prime assets is estimated to be more significant, as in the case of Milan, going from 6bps for prime segments to 22bps for non-prime segments.
- In an efficient market, we would assume that the 12bps excess climate risk premium for non-prime assets is reflected in the transaction yields as priced by markets participants.
- However, we suspect that this is currently not (yet) the case.
Appendix
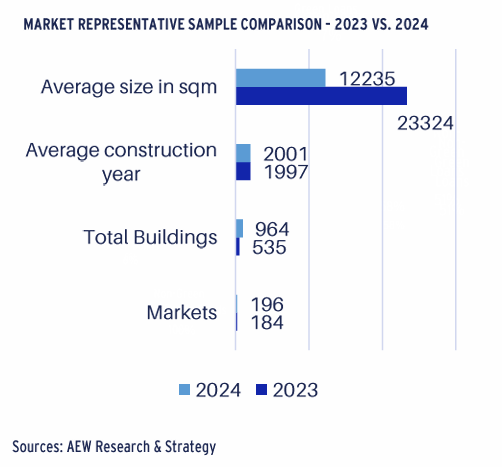
A: Increased 2024 Sample Improved Market Representation
- The primary objective of sampling is to create a representative selection of buildings that corresponds to our forecast coverage of 196 markets, covering 5 property sectors across 20 European countries.
- This year the sample is extended to cover 964 buildings (vs. 535 in 2023).
- A wider area was used in our mapping of buildings around cities, incorporating smaller and less central assets which decreased the average size in m2 relative to 2023 sample.
- In our comparisons between final energy use estimates by CFP and BPIE we use the same underlying sample as discussed above.
- Our approach recognises that comparisons with CRREM and Deepki are not using the same building sample portfolio but are based on country and sector averages.
- CRREM energy use country and sector averages are based on metered data in 2020 and are estimated thereafter.
- Deepki’s country and sector averages are based on metered data
B: Typical retrofits recommended by CFP's algorithms per property type
- In our report we use CFP’s preliminary estimates of building's energy efficiency. These estimates are based on four inputs that we provide for each of the 964 buildings:
- year of construction
- number of floors
- total square footage
- type of property
- These data points are referenced by CFP to a comprehensive database containing over 350 archetypes of buildings and residences, allowing for preliminary estimation the current energy use with 70% precision.
- Based on these estimates, commercial buildings are recommended all or some of the following retrofits: energy management system, roof & wall insulation, hybrid heat pump, LED lighting, lower heating temperature.
- In addition, residential buildings may be recommended smart thermostats, floor insulation, double/triple glazing.
C: Conversion of embodied carbon of retrofits into operational final energy use
- Conversion of embodied kg of CO2 of the required retrofits into the required energy reductions measured in kWh is complex because of the differences in energy sources and their use across our sample’s countries and property sectors.
- CRREM tool reflects these differences in the pathways, however, direct conversion for each country & property sector produces disproportionate results as it penalises highly efficient countries (with high energy use and low carbon emissions), and rewards less efficient highly-carbon-dependent countries.
- Therefore, after consultation with CRREM, and assuming that their estimates of embodied carbon for the light, medium and deep retrofits account for the average materials, transportation, energy sources and technology of the production, a simplified conversion factor of 2.9 kg of CO2 per kWh was applied across the sample, which is more suitable for our high-level market inference.
This material is intended for information purposes only and does not constitute investment advice or a recommendation. The information and opinions contained in the material have been compiled or arrived at based upon information obtained from sources believed to be reliable, but we do not guarantee its accuracy, completeness or fairness. Opinions expressed reflect prevailing market conditions and are subject to change. Neither this material, nor any of its contents, may be used for any purpose without the consent and knowledge of AEW. There is no assurance that any prediction, projection or forecast will be realized.